English vs Immigrants from Cuba Wage/Income Gap
COMPARE
English
Immigrants from Cuba
Wage/Income Gap
Wage/Income Gap Comparison
English
Immigrants from Cuba
29.5%
WAGE/INCOME GAP
0.0/ 100
METRIC RATING
336th/ 347
METRIC RANK
22.4%
WAGE/INCOME GAP
100.0/ 100
METRIC RATING
58th/ 347
METRIC RANK
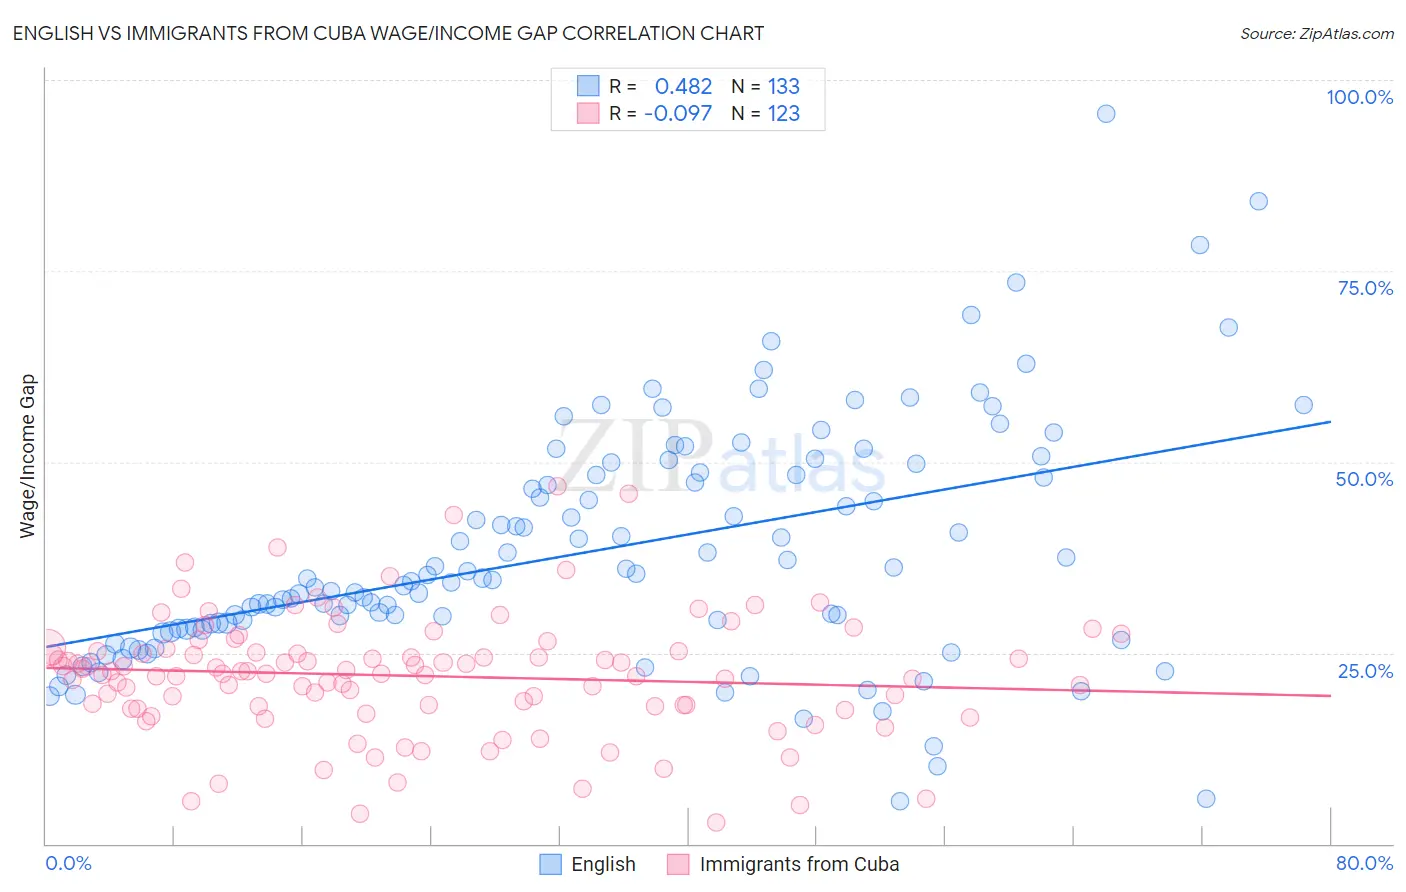
English vs Immigrants from Cuba Wage/Income Gap Correlation Chart
The statistical analysis conducted on geographies consisting of 575,625,723 people shows a moderate positive correlation between the proportion of English and wage/income gap percentage in the United States with a correlation coefficient (R) of 0.482 and weighted average of 29.5%. Similarly, the statistical analysis conducted on geographies consisting of 325,829,876 people shows a slight negative correlation between the proportion of Immigrants from Cuba and wage/income gap percentage in the United States with a correlation coefficient (R) of -0.097 and weighted average of 22.4%, a difference of 31.8%.
Wage/Income Gap Correlation Summary
| Measurement | English | Immigrants from Cuba |
| Minimum | 5.6% | 2.8% |
| Maximum | 95.6% | 46.8% |
| Range | 90.1% | 44.0% |
| Mean | 38.2% | 22.0% |
| Median | 34.6% | 22.3% |
| Interquartile 25% (IQ1) | 28.2% | 18.0% |
| Interquartile 75% (IQ3) | 48.5% | 25.3% |
| Interquartile Range (IQR) | 20.3% | 7.3% |
| Standard Deviation (Sample) | 15.5% | 7.9% |
| Standard Deviation (Population) | 15.4% | 7.9% |
Similar Demographics by Wage/Income Gap
Demographics Similar to English by Wage/Income Gap
In terms of wage/income gap, the demographic groups most similar to English are Immigrants from Taiwan (29.5%, a difference of 0.010%), Swedish (29.4%, a difference of 0.14%), European (29.4%, a difference of 0.28%), Immigrants from South Central Asia (29.3%, a difference of 0.47%), and Dutch (29.6%, a difference of 0.58%).
| Demographics | Rating | Rank | Wage/Income Gap |
| Scottish | 0.0 /100 | #329 | Tragic 29.1% |
| Germans | 0.0 /100 | #330 | Tragic 29.2% |
| Czechs | 0.0 /100 | #331 | Tragic 29.2% |
| Immigrants | South Central Asia | 0.0 /100 | #332 | Tragic 29.3% |
| Europeans | 0.0 /100 | #333 | Tragic 29.4% |
| Swedes | 0.0 /100 | #334 | Tragic 29.4% |
| Immigrants | Taiwan | 0.0 /100 | #335 | Tragic 29.5% |
| English | 0.0 /100 | #336 | Tragic 29.5% |
| Dutch | 0.0 /100 | #337 | Tragic 29.6% |
| Filipinos | 0.0 /100 | #338 | Tragic 29.7% |
| Iranians | 0.0 /100 | #339 | Tragic 29.7% |
| Swiss | 0.0 /100 | #340 | Tragic 30.0% |
| Thais | 0.0 /100 | #341 | Tragic 30.5% |
| Pennsylvania Germans | 0.0 /100 | #342 | Tragic 30.7% |
| Danes | 0.0 /100 | #343 | Tragic 31.0% |
Demographics Similar to Immigrants from Cuba by Wage/Income Gap
In terms of wage/income gap, the demographic groups most similar to Immigrants from Cuba are Navajo (22.4%, a difference of 0.040%), Immigrants from Middle Africa (22.4%, a difference of 0.060%), Ghanaian (22.3%, a difference of 0.080%), Immigrants from Ghana (22.3%, a difference of 0.18%), and Immigrants from Zaire (22.3%, a difference of 0.22%).
| Demographics | Rating | Rank | Wage/Income Gap |
| Tohono O'odham | 100.0 /100 | #51 | Exceptional 22.1% |
| Immigrants | Cameroon | 100.0 /100 | #52 | Exceptional 22.2% |
| Bangladeshis | 100.0 /100 | #53 | Exceptional 22.2% |
| Nepalese | 100.0 /100 | #54 | Exceptional 22.2% |
| Immigrants | Zaire | 100.0 /100 | #55 | Exceptional 22.3% |
| Immigrants | Ghana | 100.0 /100 | #56 | Exceptional 22.3% |
| Ghanaians | 100.0 /100 | #57 | Exceptional 22.3% |
| Immigrants | Cuba | 100.0 /100 | #58 | Exceptional 22.4% |
| Navajo | 100.0 /100 | #59 | Exceptional 22.4% |
| Immigrants | Middle Africa | 100.0 /100 | #60 | Exceptional 22.4% |
| Immigrants | Fiji | 100.0 /100 | #61 | Exceptional 22.4% |
| Immigrants | Guatemala | 100.0 /100 | #62 | Exceptional 22.5% |
| Immigrants | Ecuador | 100.0 /100 | #63 | Exceptional 22.5% |
| Spanish American Indians | 100.0 /100 | #64 | Exceptional 22.5% |
| Guatemalans | 99.9 /100 | #65 | Exceptional 22.6% |