Egyptian vs Immigrants from Egypt Median Household Income
COMPARE
Egyptian
Immigrants from Egypt
Median Household Income
Median Household Income Comparison
Egyptians
Immigrants from Egypt
$95,673
MEDIAN HOUSEHOLD INCOME
99.9/ 100
METRIC RATING
54th/ 347
METRIC RANK
$93,700
MEDIAN HOUSEHOLD INCOME
99.6/ 100
METRIC RATING
73rd/ 347
METRIC RANK
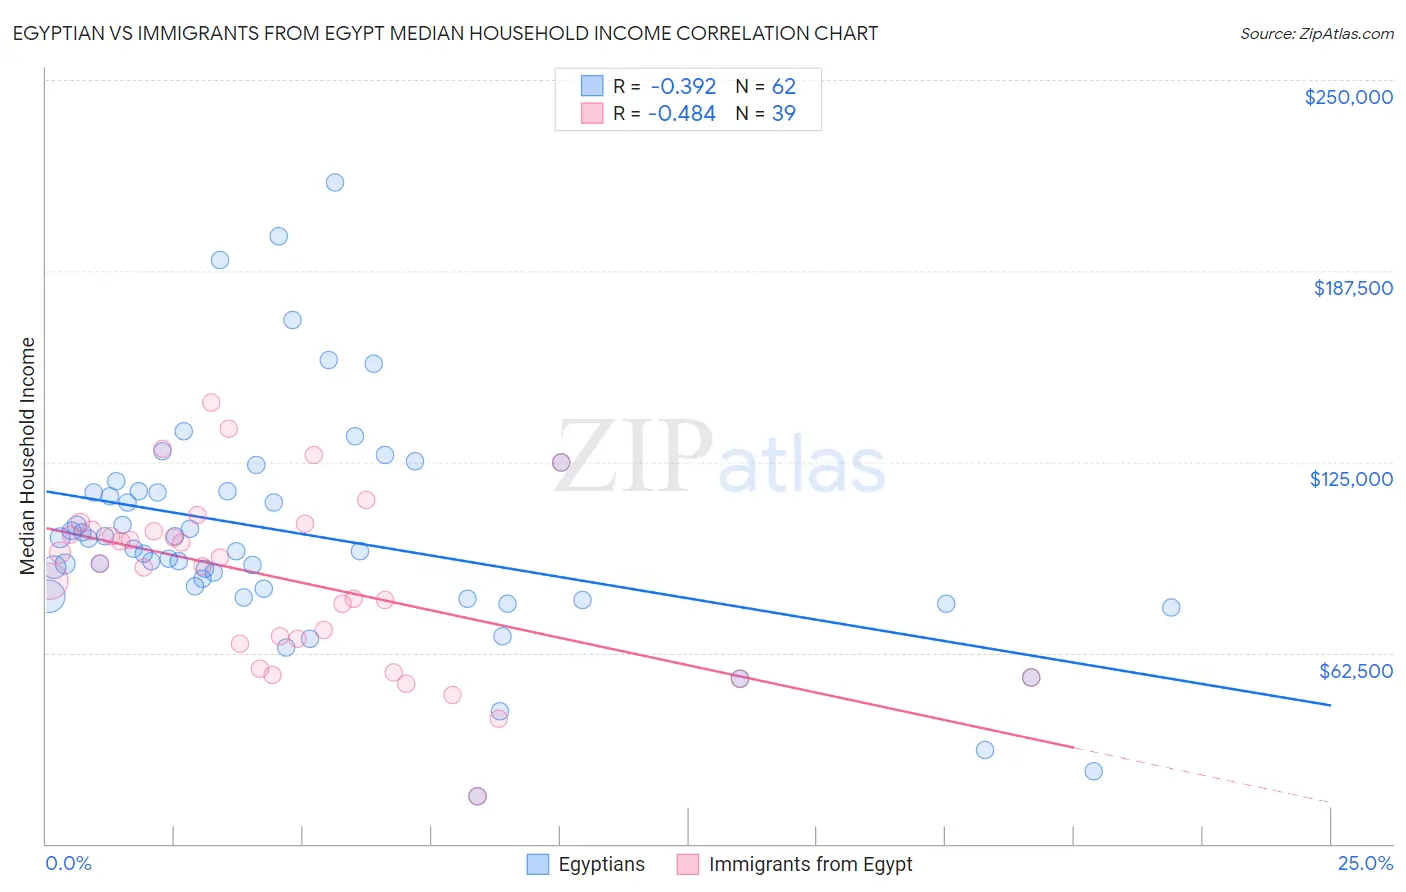
Egyptian vs Immigrants from Egypt Median Household Income Correlation Chart
The statistical analysis conducted on geographies consisting of 276,717,695 people shows a mild negative correlation between the proportion of Egyptians and median household income in the United States with a correlation coefficient (R) of -0.392 and weighted average of $95,673. Similarly, the statistical analysis conducted on geographies consisting of 245,403,618 people shows a moderate negative correlation between the proportion of Immigrants from Egypt and median household income in the United States with a correlation coefficient (R) of -0.484 and weighted average of $93,700, a difference of 2.1%.
Median Household Income Correlation Summary
| Measurement | Egyptian | Immigrants from Egypt |
| Minimum | $15,682 | $15,682 |
| Maximum | $216,495 | $144,322 |
| Range | $200,813 | $128,640 |
| Mean | $100,993 | $86,856 |
| Median | $96,117 | $91,717 |
| Interquartile 25% (IQ1) | $81,164 | $65,358 |
| Interquartile 75% (IQ3) | $115,184 | $102,559 |
| Interquartile Range (IQR) | $34,020 | $37,201 |
| Standard Deviation (Sample) | $37,055 | $28,300 |
| Standard Deviation (Population) | $36,755 | $27,935 |
Demographics Similar to Egyptians and Immigrants from Egypt by Median Household Income
In terms of median household income, the demographic groups most similar to Egyptians are Paraguayan ($95,737, a difference of 0.070%), Immigrants from Czechoslovakia ($95,319, a difference of 0.37%), Immigrants from Austria ($95,277, a difference of 0.42%), New Zealander ($95,146, a difference of 0.55%), and Soviet Union ($95,098, a difference of 0.61%). Similarly, the demographic groups most similar to Immigrants from Egypt are Lithuanian ($93,852, a difference of 0.16%), Immigrants from Philippines ($93,899, a difference of 0.21%), Immigrants from Fiji ($93,933, a difference of 0.25%), Argentinean ($93,960, a difference of 0.28%), and Mongolian ($93,971, a difference of 0.29%).
| Demographics | Rating | Rank | Median Household Income |
| Paraguayans | 99.9 /100 | #53 | Exceptional $95,737 |
| Egyptians | 99.9 /100 | #54 | Exceptional $95,673 |
| Immigrants | Czechoslovakia | 99.9 /100 | #55 | Exceptional $95,319 |
| Immigrants | Austria | 99.9 /100 | #56 | Exceptional $95,277 |
| New Zealanders | 99.8 /100 | #57 | Exceptional $95,146 |
| Soviet Union | 99.8 /100 | #58 | Exceptional $95,098 |
| Immigrants | Europe | 99.8 /100 | #59 | Exceptional $95,032 |
| Koreans | 99.8 /100 | #60 | Exceptional $95,018 |
| Laotians | 99.8 /100 | #61 | Exceptional $94,990 |
| Immigrants | Norway | 99.8 /100 | #62 | Exceptional $94,846 |
| Greeks | 99.8 /100 | #63 | Exceptional $94,735 |
| Immigrants | Netherlands | 99.7 /100 | #64 | Exceptional $94,411 |
| Immigrants | Belarus | 99.7 /100 | #65 | Exceptional $94,399 |
| Immigrants | Romania | 99.7 /100 | #66 | Exceptional $94,222 |
| Immigrants | Scotland | 99.7 /100 | #67 | Exceptional $94,091 |
| Mongolians | 99.7 /100 | #68 | Exceptional $93,971 |
| Argentineans | 99.7 /100 | #69 | Exceptional $93,960 |
| Immigrants | Fiji | 99.7 /100 | #70 | Exceptional $93,933 |
| Immigrants | Philippines | 99.6 /100 | #71 | Exceptional $93,899 |
| Lithuanians | 99.6 /100 | #72 | Exceptional $93,852 |
| Immigrants | Egypt | 99.6 /100 | #73 | Exceptional $93,700 |