Egyptian vs Immigrants from Moldova Median Household Income
COMPARE
Egyptian
Immigrants from Moldova
Median Household Income
Median Household Income Comparison
Egyptians
Immigrants from Moldova
$95,673
MEDIAN HOUSEHOLD INCOME
99.9/ 100
METRIC RATING
54th/ 347
METRIC RANK
$91,446
MEDIAN HOUSEHOLD INCOME
98.3/ 100
METRIC RATING
101st/ 347
METRIC RANK
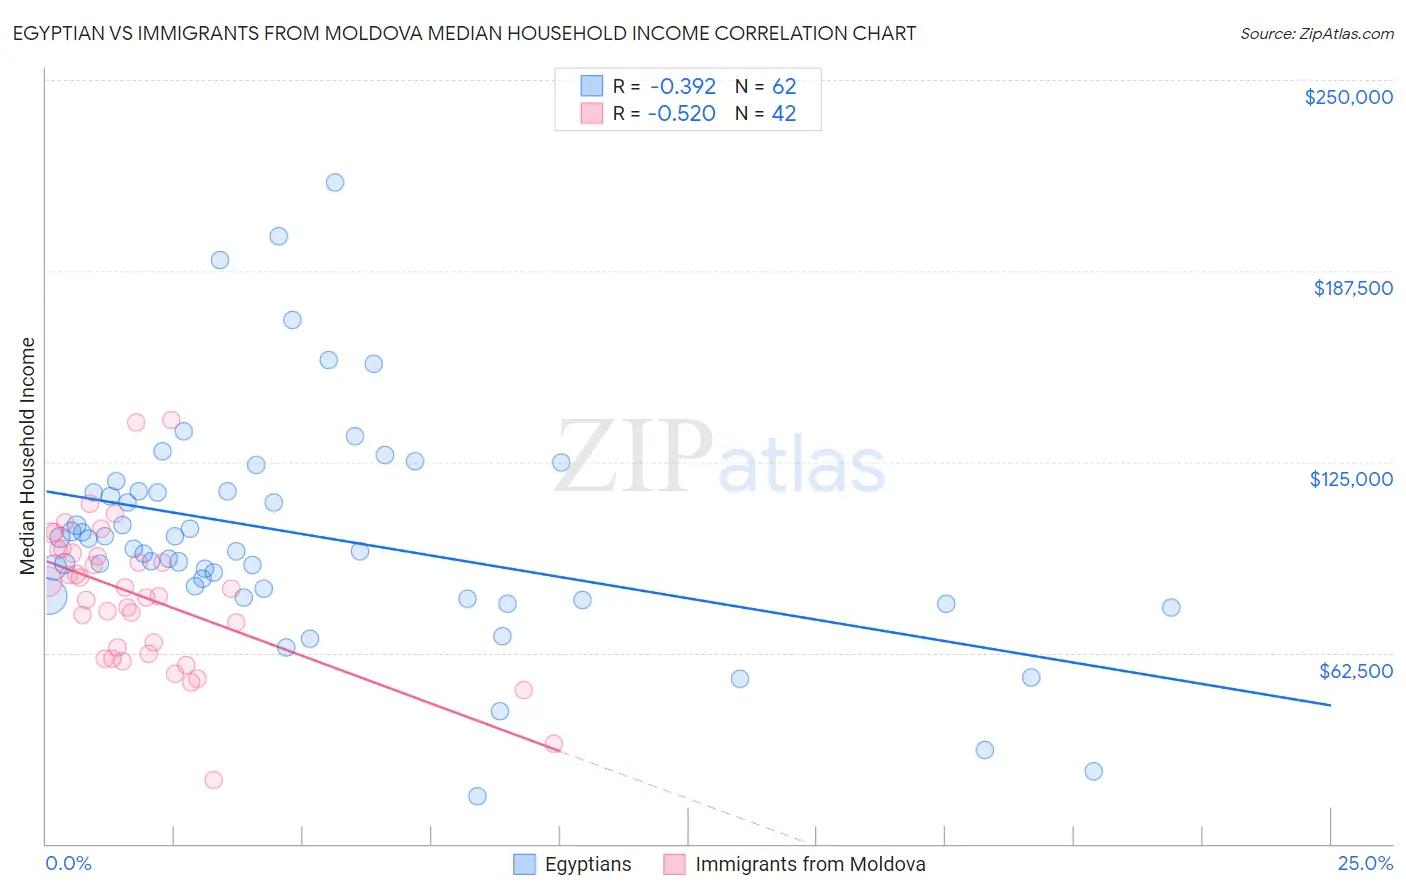
Egyptian vs Immigrants from Moldova Median Household Income Correlation Chart
The statistical analysis conducted on geographies consisting of 276,717,695 people shows a mild negative correlation between the proportion of Egyptians and median household income in the United States with a correlation coefficient (R) of -0.392 and weighted average of $95,673. Similarly, the statistical analysis conducted on geographies consisting of 124,363,535 people shows a substantial negative correlation between the proportion of Immigrants from Moldova and median household income in the United States with a correlation coefficient (R) of -0.520 and weighted average of $91,446, a difference of 4.6%.
Median Household Income Correlation Summary
| Measurement | Egyptian | Immigrants from Moldova |
| Minimum | $15,682 | $20,699 |
| Maximum | $216,495 | $138,879 |
| Range | $200,813 | $118,180 |
| Mean | $100,993 | $80,883 |
| Median | $96,117 | $82,096 |
| Interquartile 25% (IQ1) | $81,164 | $62,083 |
| Interquartile 75% (IQ3) | $115,184 | $95,143 |
| Interquartile Range (IQR) | $34,020 | $33,060 |
| Standard Deviation (Sample) | $37,055 | $23,912 |
| Standard Deviation (Population) | $36,755 | $23,626 |
Similar Demographics by Median Household Income
Demographics Similar to Egyptians by Median Household Income
In terms of median household income, the demographic groups most similar to Egyptians are Paraguayan ($95,737, a difference of 0.070%), Immigrants from South Africa ($95,800, a difference of 0.13%), Estonian ($95,930, a difference of 0.27%), Immigrants from Czechoslovakia ($95,319, a difference of 0.37%), and Immigrants from Austria ($95,277, a difference of 0.42%).
| Demographics | Rating | Rank | Median Household Income |
| Immigrants | Russia | 99.9 /100 | #47 | Exceptional $96,378 |
| Cambodians | 99.9 /100 | #48 | Exceptional $96,324 |
| Immigrants | Malaysia | 99.9 /100 | #49 | Exceptional $96,292 |
| Bulgarians | 99.9 /100 | #50 | Exceptional $96,290 |
| Estonians | 99.9 /100 | #51 | Exceptional $95,930 |
| Immigrants | South Africa | 99.9 /100 | #52 | Exceptional $95,800 |
| Paraguayans | 99.9 /100 | #53 | Exceptional $95,737 |
| Egyptians | 99.9 /100 | #54 | Exceptional $95,673 |
| Immigrants | Czechoslovakia | 99.9 /100 | #55 | Exceptional $95,319 |
| Immigrants | Austria | 99.9 /100 | #56 | Exceptional $95,277 |
| New Zealanders | 99.8 /100 | #57 | Exceptional $95,146 |
| Soviet Union | 99.8 /100 | #58 | Exceptional $95,098 |
| Immigrants | Europe | 99.8 /100 | #59 | Exceptional $95,032 |
| Koreans | 99.8 /100 | #60 | Exceptional $95,018 |
| Laotians | 99.8 /100 | #61 | Exceptional $94,990 |
Demographics Similar to Immigrants from Moldova by Median Household Income
In terms of median household income, the demographic groups most similar to Immigrants from Moldova are Ukrainian ($91,456, a difference of 0.010%), Immigrants from South Eastern Asia ($91,541, a difference of 0.10%), Austrian ($91,339, a difference of 0.12%), Immigrants from Southern Europe ($91,605, a difference of 0.17%), and Immigrants from Serbia ($91,730, a difference of 0.31%).
| Demographics | Rating | Rank | Median Household Income |
| Immigrants | North America | 98.7 /100 | #94 | Exceptional $91,860 |
| Armenians | 98.7 /100 | #95 | Exceptional $91,807 |
| Jordanians | 98.7 /100 | #96 | Exceptional $91,794 |
| Immigrants | Serbia | 98.6 /100 | #97 | Exceptional $91,730 |
| Immigrants | Southern Europe | 98.5 /100 | #98 | Exceptional $91,605 |
| Immigrants | South Eastern Asia | 98.4 /100 | #99 | Exceptional $91,541 |
| Ukrainians | 98.3 /100 | #100 | Exceptional $91,456 |
| Immigrants | Moldova | 98.3 /100 | #101 | Exceptional $91,446 |
| Austrians | 98.2 /100 | #102 | Exceptional $91,339 |
| Immigrants | Ukraine | 98.0 /100 | #103 | Exceptional $91,124 |
| Immigrants | Kazakhstan | 97.8 /100 | #104 | Exceptional $91,015 |
| Immigrants | Brazil | 97.7 /100 | #105 | Exceptional $90,907 |
| Macedonians | 97.4 /100 | #106 | Exceptional $90,761 |
| Croatians | 97.3 /100 | #107 | Exceptional $90,685 |
| Zimbabweans | 97.2 /100 | #108 | Exceptional $90,618 |