Egyptian vs Immigrants from Egypt Unemployment Among Ages 35 to 44 years
COMPARE
Egyptian
Immigrants from Egypt
Unemployment Among Ages 35 to 44 years
Unemployment Among Ages 35 to 44 years Comparison
Egyptians
Immigrants from Egypt
4.5%
UNEMPLOYMENT AMONG AGES 35 TO 44 YEARS
94.5/ 100
METRIC RATING
89th/ 347
METRIC RANK
4.5%
UNEMPLOYMENT AMONG AGES 35 TO 44 YEARS
92.3/ 100
METRIC RATING
99th/ 347
METRIC RANK
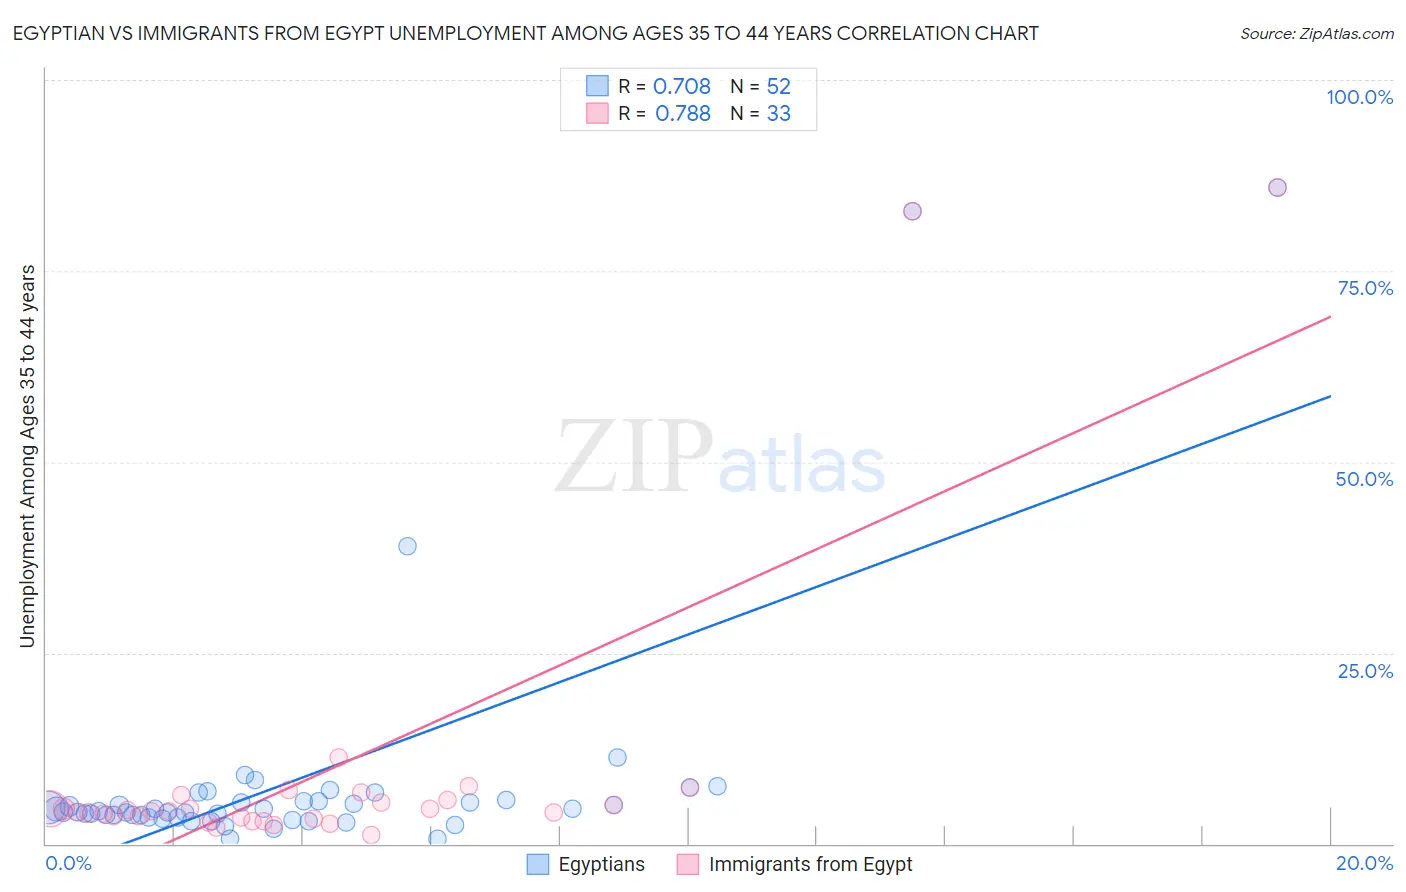
Egyptian vs Immigrants from Egypt Unemployment Among Ages 35 to 44 years Correlation Chart
The statistical analysis conducted on geographies consisting of 273,926,124 people shows a strong positive correlation between the proportion of Egyptians and unemployment rate among population between the ages 35 and 44 in the United States with a correlation coefficient (R) of 0.708 and weighted average of 4.5%. Similarly, the statistical analysis conducted on geographies consisting of 243,386,535 people shows a strong positive correlation between the proportion of Immigrants from Egypt and unemployment rate among population between the ages 35 and 44 in the United States with a correlation coefficient (R) of 0.788 and weighted average of 4.5%, a difference of 0.70%.
Unemployment Among Ages 35 to 44 years Correlation Summary
| Measurement | Egyptian | Immigrants from Egypt |
| Minimum | 0.70% | 1.1% |
| Maximum | 86.0% | 86.0% |
| Range | 85.3% | 84.9% |
| Mean | 8.4% | 9.4% |
| Median | 4.4% | 4.2% |
| Interquartile 25% (IQ1) | 3.6% | 3.3% |
| Interquartile 75% (IQ3) | 5.7% | 6.1% |
| Interquartile Range (IQR) | 2.1% | 2.8% |
| Standard Deviation (Sample) | 16.2% | 19.4% |
| Standard Deviation (Population) | 16.0% | 19.2% |
Demographics Similar to Egyptians and Immigrants from Egypt by Unemployment Among Ages 35 to 44 years
In terms of unemployment among ages 35 to 44 years, the demographic groups most similar to Egyptians are Australian (4.5%, a difference of 0.020%), Immigrants from Latvia (4.4%, a difference of 0.090%), Immigrants from Northern Europe (4.5%, a difference of 0.090%), Estonian (4.5%, a difference of 0.10%), and Immigrants from Bosnia and Herzegovina (4.4%, a difference of 0.11%). Similarly, the demographic groups most similar to Immigrants from Egypt are Immigrants from Canada (4.5%, a difference of 0.010%), Immigrants from France (4.5%, a difference of 0.060%), Italian (4.5%, a difference of 0.090%), Immigrants from Netherlands (4.5%, a difference of 0.10%), and Immigrants from Sudan (4.5%, a difference of 0.13%).
| Demographics | Rating | Rank | Unemployment Among Ages 35 to 44 years |
| Immigrants | Chile | 95.2 /100 | #84 | Exceptional 4.4% |
| Immigrants | Kenya | 95.0 /100 | #85 | Exceptional 4.4% |
| Serbians | 94.9 /100 | #86 | Exceptional 4.4% |
| Immigrants | Bosnia and Herzegovina | 94.8 /100 | #87 | Exceptional 4.4% |
| Immigrants | Latvia | 94.8 /100 | #88 | Exceptional 4.4% |
| Egyptians | 94.5 /100 | #89 | Exceptional 4.5% |
| Australians | 94.5 /100 | #90 | Exceptional 4.5% |
| Immigrants | Northern Europe | 94.3 /100 | #91 | Exceptional 4.5% |
| Estonians | 94.3 /100 | #92 | Exceptional 4.5% |
| Iranians | 93.9 /100 | #93 | Exceptional 4.5% |
| Russians | 93.8 /100 | #94 | Exceptional 4.5% |
| Yugoslavians | 93.6 /100 | #95 | Exceptional 4.5% |
| Scottish | 93.5 /100 | #96 | Exceptional 4.5% |
| Immigrants | France | 92.5 /100 | #97 | Exceptional 4.5% |
| Immigrants | Canada | 92.3 /100 | #98 | Exceptional 4.5% |
| Immigrants | Egypt | 92.3 /100 | #99 | Exceptional 4.5% |
| Italians | 91.9 /100 | #100 | Exceptional 4.5% |
| Immigrants | Netherlands | 91.9 /100 | #101 | Exceptional 4.5% |
| Immigrants | Sudan | 91.8 /100 | #102 | Exceptional 4.5% |
| Welsh | 91.6 /100 | #103 | Exceptional 4.5% |
| Finns | 91.6 /100 | #104 | Exceptional 4.5% |