Egyptian vs Immigrants from Yemen Median Household Income
COMPARE
Egyptian
Immigrants from Yemen
Median Household Income
Median Household Income Comparison
Egyptians
Immigrants from Yemen
$95,673
MEDIAN HOUSEHOLD INCOME
99.9/ 100
METRIC RATING
54th/ 347
METRIC RANK
$65,194
MEDIAN HOUSEHOLD INCOME
0.0/ 100
METRIC RATING
338th/ 347
METRIC RANK
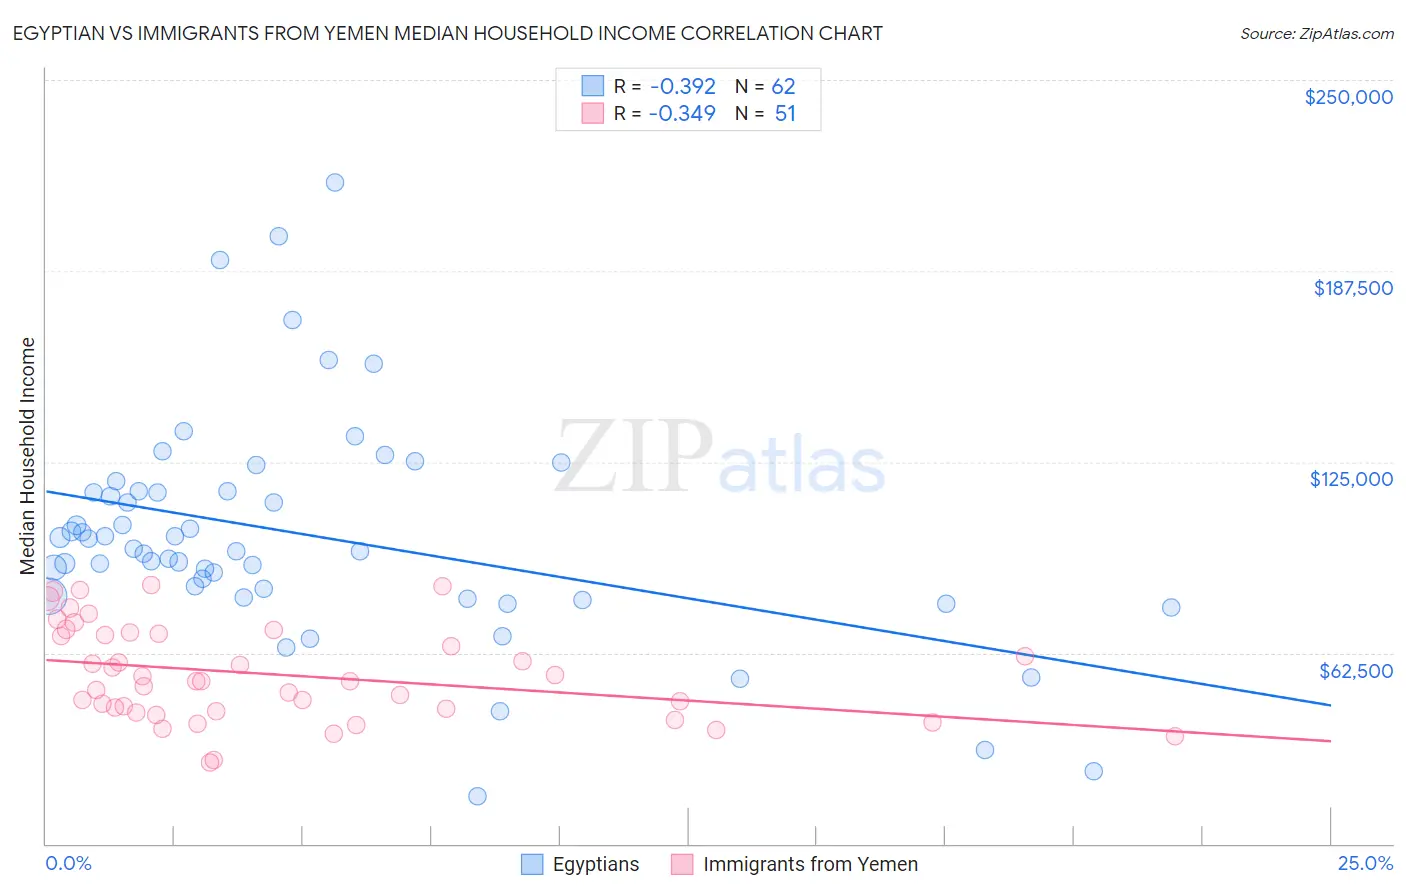
Egyptian vs Immigrants from Yemen Median Household Income Correlation Chart
The statistical analysis conducted on geographies consisting of 276,717,695 people shows a mild negative correlation between the proportion of Egyptians and median household income in the United States with a correlation coefficient (R) of -0.392 and weighted average of $95,673. Similarly, the statistical analysis conducted on geographies consisting of 82,433,611 people shows a mild negative correlation between the proportion of Immigrants from Yemen and median household income in the United States with a correlation coefficient (R) of -0.349 and weighted average of $65,194, a difference of 46.8%.
Median Household Income Correlation Summary
| Measurement | Egyptian | Immigrants from Yemen |
| Minimum | $15,682 | $26,635 |
| Maximum | $216,495 | $84,689 |
| Range | $200,813 | $58,054 |
| Mean | $100,993 | $55,369 |
| Median | $96,117 | $53,125 |
| Interquartile 25% (IQ1) | $81,164 | $43,348 |
| Interquartile 75% (IQ3) | $115,184 | $68,707 |
| Interquartile Range (IQR) | $34,020 | $25,359 |
| Standard Deviation (Sample) | $37,055 | $15,452 |
| Standard Deviation (Population) | $36,755 | $15,299 |
Similar Demographics by Median Household Income
Demographics Similar to Egyptians by Median Household Income
In terms of median household income, the demographic groups most similar to Egyptians are Paraguayan ($95,737, a difference of 0.070%), Immigrants from South Africa ($95,800, a difference of 0.13%), Estonian ($95,930, a difference of 0.27%), Immigrants from Czechoslovakia ($95,319, a difference of 0.37%), and Immigrants from Austria ($95,277, a difference of 0.42%).
| Demographics | Rating | Rank | Median Household Income |
| Immigrants | Russia | 99.9 /100 | #47 | Exceptional $96,378 |
| Cambodians | 99.9 /100 | #48 | Exceptional $96,324 |
| Immigrants | Malaysia | 99.9 /100 | #49 | Exceptional $96,292 |
| Bulgarians | 99.9 /100 | #50 | Exceptional $96,290 |
| Estonians | 99.9 /100 | #51 | Exceptional $95,930 |
| Immigrants | South Africa | 99.9 /100 | #52 | Exceptional $95,800 |
| Paraguayans | 99.9 /100 | #53 | Exceptional $95,737 |
| Egyptians | 99.9 /100 | #54 | Exceptional $95,673 |
| Immigrants | Czechoslovakia | 99.9 /100 | #55 | Exceptional $95,319 |
| Immigrants | Austria | 99.9 /100 | #56 | Exceptional $95,277 |
| New Zealanders | 99.8 /100 | #57 | Exceptional $95,146 |
| Soviet Union | 99.8 /100 | #58 | Exceptional $95,098 |
| Immigrants | Europe | 99.8 /100 | #59 | Exceptional $95,032 |
| Koreans | 99.8 /100 | #60 | Exceptional $95,018 |
| Laotians | 99.8 /100 | #61 | Exceptional $94,990 |
Demographics Similar to Immigrants from Yemen by Median Household Income
In terms of median household income, the demographic groups most similar to Immigrants from Yemen are Hopi ($65,043, a difference of 0.23%), Pueblo ($64,692, a difference of 0.78%), Kiowa ($65,914, a difference of 1.1%), Crow ($63,681, a difference of 2.4%), and Immigrants from Congo ($66,768, a difference of 2.4%).
| Demographics | Rating | Rank | Median Household Income |
| Natives/Alaskans | 0.0 /100 | #331 | Tragic $67,879 |
| Sioux | 0.0 /100 | #332 | Tragic $67,792 |
| Creek | 0.0 /100 | #333 | Tragic $67,715 |
| Blacks/African Americans | 0.0 /100 | #334 | Tragic $67,573 |
| Cheyenne | 0.0 /100 | #335 | Tragic $66,974 |
| Immigrants | Congo | 0.0 /100 | #336 | Tragic $66,768 |
| Kiowa | 0.0 /100 | #337 | Tragic $65,914 |
| Immigrants | Yemen | 0.0 /100 | #338 | Tragic $65,194 |
| Hopi | 0.0 /100 | #339 | Tragic $65,043 |
| Pueblo | 0.0 /100 | #340 | Tragic $64,692 |
| Crow | 0.0 /100 | #341 | Tragic $63,681 |
| Pima | 0.0 /100 | #342 | Tragic $63,262 |
| Houma | 0.0 /100 | #343 | Tragic $62,575 |
| Tohono O'odham | 0.0 /100 | #344 | Tragic $61,663 |
| Puerto Ricans | 0.0 /100 | #345 | Tragic $59,197 |