Maltese vs Immigrants from Egypt Median Household Income
COMPARE
Maltese
Immigrants from Egypt
Median Household Income
Median Household Income Comparison
Maltese
Immigrants from Egypt
$97,015
MEDIAN HOUSEHOLD INCOME
100.0/ 100
METRIC RATING
40th/ 347
METRIC RANK
$93,700
MEDIAN HOUSEHOLD INCOME
99.6/ 100
METRIC RATING
73rd/ 347
METRIC RANK
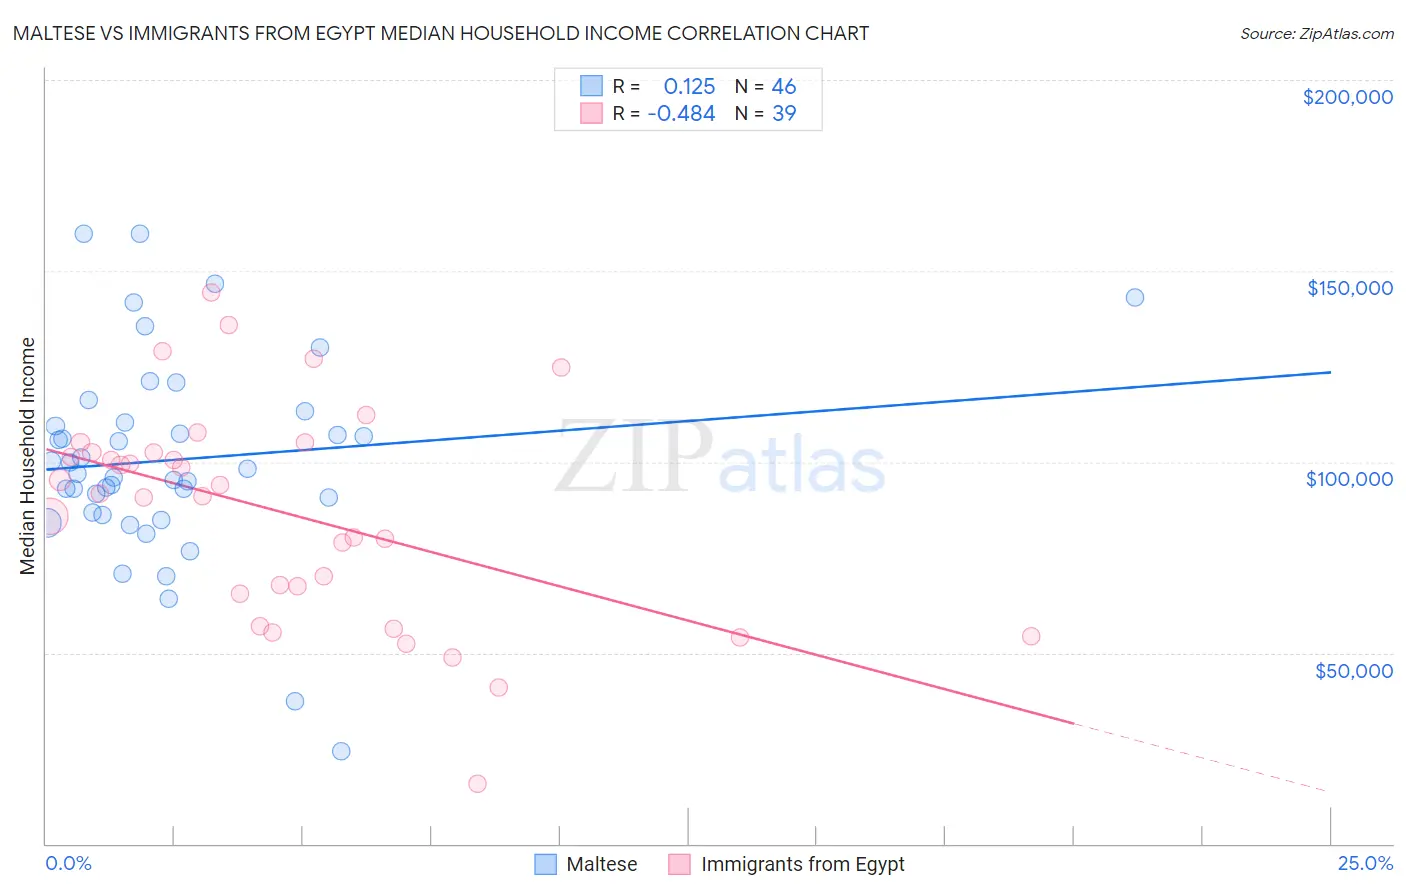
Maltese vs Immigrants from Egypt Median Household Income Correlation Chart
The statistical analysis conducted on geographies consisting of 126,420,319 people shows a poor positive correlation between the proportion of Maltese and median household income in the United States with a correlation coefficient (R) of 0.125 and weighted average of $97,015. Similarly, the statistical analysis conducted on geographies consisting of 245,403,618 people shows a moderate negative correlation between the proportion of Immigrants from Egypt and median household income in the United States with a correlation coefficient (R) of -0.484 and weighted average of $93,700, a difference of 3.5%.
Median Household Income Correlation Summary
| Measurement | Maltese | Immigrants from Egypt |
| Minimum | $24,250 | $15,682 |
| Maximum | $159,651 | $144,322 |
| Range | $135,401 | $128,640 |
| Mean | $100,571 | $86,856 |
| Median | $97,403 | $91,717 |
| Interquartile 25% (IQ1) | $86,626 | $65,358 |
| Interquartile 75% (IQ3) | $110,225 | $102,559 |
| Interquartile Range (IQR) | $23,599 | $37,201 |
| Standard Deviation (Sample) | $26,669 | $28,300 |
| Standard Deviation (Population) | $26,378 | $27,935 |
Similar Demographics by Median Household Income
Demographics Similar to Maltese by Median Household Income
In terms of median household income, the demographic groups most similar to Maltese are Afghan ($97,026, a difference of 0.010%), Immigrants from Turkey ($96,964, a difference of 0.050%), Immigrants from Lithuania ($96,836, a difference of 0.18%), Immigrants from France ($96,743, a difference of 0.28%), and Immigrants from Indonesia ($97,297, a difference of 0.29%).
| Demographics | Rating | Rank | Median Household Income |
| Chinese | 100.0 /100 | #33 | Exceptional $98,496 |
| Russians | 100.0 /100 | #34 | Exceptional $98,008 |
| Immigrants | Switzerland | 100.0 /100 | #35 | Exceptional $97,979 |
| Immigrants | Pakistan | 100.0 /100 | #36 | Exceptional $97,528 |
| Latvians | 100.0 /100 | #37 | Exceptional $97,311 |
| Immigrants | Indonesia | 100.0 /100 | #38 | Exceptional $97,297 |
| Afghans | 100.0 /100 | #39 | Exceptional $97,026 |
| Maltese | 100.0 /100 | #40 | Exceptional $97,015 |
| Immigrants | Turkey | 100.0 /100 | #41 | Exceptional $96,964 |
| Immigrants | Lithuania | 99.9 /100 | #42 | Exceptional $96,836 |
| Immigrants | France | 99.9 /100 | #43 | Exceptional $96,743 |
| Immigrants | Greece | 99.9 /100 | #44 | Exceptional $96,675 |
| Israelis | 99.9 /100 | #45 | Exceptional $96,552 |
| Australians | 99.9 /100 | #46 | Exceptional $96,490 |
| Immigrants | Russia | 99.9 /100 | #47 | Exceptional $96,378 |
Demographics Similar to Immigrants from Egypt by Median Household Income
In terms of median household income, the demographic groups most similar to Immigrants from Egypt are Immigrants from Latvia ($93,602, a difference of 0.10%), Lithuanian ($93,852, a difference of 0.16%), Immigrants from Philippines ($93,899, a difference of 0.21%), Immigrants from Fiji ($93,933, a difference of 0.25%), and Immigrants from Italy ($93,465, a difference of 0.25%).
| Demographics | Rating | Rank | Median Household Income |
| Immigrants | Romania | 99.7 /100 | #66 | Exceptional $94,222 |
| Immigrants | Scotland | 99.7 /100 | #67 | Exceptional $94,091 |
| Mongolians | 99.7 /100 | #68 | Exceptional $93,971 |
| Argentineans | 99.7 /100 | #69 | Exceptional $93,960 |
| Immigrants | Fiji | 99.7 /100 | #70 | Exceptional $93,933 |
| Immigrants | Philippines | 99.6 /100 | #71 | Exceptional $93,899 |
| Lithuanians | 99.6 /100 | #72 | Exceptional $93,852 |
| Immigrants | Egypt | 99.6 /100 | #73 | Exceptional $93,700 |
| Immigrants | Latvia | 99.6 /100 | #74 | Exceptional $93,602 |
| Immigrants | Italy | 99.5 /100 | #75 | Exceptional $93,465 |
| South Africans | 99.5 /100 | #76 | Exceptional $93,379 |
| Immigrants | Afghanistan | 99.5 /100 | #77 | Exceptional $93,375 |
| Immigrants | Bulgaria | 99.4 /100 | #78 | Exceptional $93,148 |
| Sri Lankans | 99.4 /100 | #79 | Exceptional $93,093 |
| Tongans | 99.4 /100 | #80 | Exceptional $93,076 |