Nicaraguan vs Immigrants from Egypt Median Household Income

COMPARE

Nicaraguan
Race
Ancestry
AfghanAfricanAlaska NativeAlaskan AthabascanAlbanianAleutAlsatianAmericanApacheArabArapahoArgentineanArmenianAssyrian/Chaldean/SyriacAustralianAustrianBahamianBangladeshiBarbadianBasqueBelgianBelizeanBermudanBhutaneseBlackfeetBolivianBrazilianBritishBritish West IndianBulgarianBurmeseCajunCambodianCanadianCape VerdeanCarpatho RusynCelticCentral AmericanCentral American IndianCherokeeCheyenneChickasawChileanChineseChippewaChoctawColombianColvilleComancheCosta RicanCreeCreekCroatianCrowCubanCypriotCzechCzechoslovakianDanishDelawareDominicanDutchDutch West IndianEastern EuropeanEcuadorianEgyptianEnglishEstonianEthiopianEuropeanFijianFilipinoFinnishFrenchFrench American IndianFrench CanadianGermanGerman RussianGhanaianGreekGuamanian/ChamorroGuatemalanGuyaneseHaitianHmongHonduranHopiHoumaHungarianIcelanderIndian (Asian)IndonesianInupiatIranianIraqiIrishIroquoisIsraeliItalianJamaicanJapaneseJordanianKenyanKiowaKoreanLaotianLatvianLebaneseLiberianLithuanianLumbeeLuxembourgerMacedonianMalaysianMalteseMarshalleseMenomineeMexicanMexican American IndianMongolianMoroccanNative HawaiianNavajoNepaleseNew ZealanderNicaraguanNigerianNorthern EuropeanNorwegianOkinawanOsageOttawaPaiutePakistaniPalestinianPanamanianParaguayanPennsylvania GermanPeruvianPimaPolishPortuguesePotawatomiPuebloPuerto RicanPuget Sound SalishRomanianRussianSalvadoranSamoanScandinavianScotch-IrishScottishSeminoleSenegaleseSerbianShoshoneSierra LeoneanSiouxSlavicSlovakSloveneSomaliSouth AfricanSouth AmericanSouth American IndianSoviet UnionSpaniardSpanishSpanish AmericanSpanish American IndianSri LankanSubsaharan AfricanSudaneseSwedishSwissSyrianTaiwaneseThaiTlingit-HaidaTohono O'OdhamTonganTrinidadian and TobagonianTsimshianTurkishU.S. Virgin IslanderUgandanUkrainianUruguayanUteVenezuelanVietnameseWelshWest IndianYakamaYaquiYugoslavianYumanYup'ikZimbabwean
Immigration
NonimmigrantsImmigrantsAfghanistanAfricaAlbaniaArgentinaArmeniaAsiaAustraliaAustriaBahamasBangladeshBarbadosBelarusBelgiumBelizeBoliviaBosnia and HerzegovinaBrazilBulgariaBurma/MyanmarCabo VerdeCambodiaCameroonCanadaCaribbeanCentral AmericaChileChinaColombiaCongoCosta RicaCroatiaCubaCzechoslovakiaDenmarkDominicaDominican RepublicEastern AfricaEastern AsiaEastern EuropeEcuadorEl SalvadorEnglandEritreaEthiopiaEuropeFijiFranceGermanyGhanaGreeceGrenadaGuatemalaGuyanaHaitiHondurasHong KongHungaryIndiaIndonesiaIranIraqIrelandIsraelItalyJamaicaJapanJordanKazakhstanKenyaKoreaKuwaitLaosLatin AmericaLatviaLebanonLiberiaLithuaniaMalaysiaMexicoMicronesiaMiddle AfricaMoldovaMoroccoNepalNetherlandsNicaraguaNigeriaNorth AmericaNorth MacedoniaNorthern AfricaNorthern EuropeNorwayOceaniaPakistanPanamaPeruPhilippinesPolandPortugalRomaniaRussiaSaudi ArabiaScotlandSenegalSerbiaSierra LeoneSingaporeSomaliaSouth AfricaSouth AmericaSouth Central AsiaSouth Eastern AsiaSouthern EuropeSpainSri LankaSt. Vincent and the GrenadinesSudanSwedenSwitzerlandSyriaTaiwanThailandTrinidad and TobagoTurkeyUgandaUkraineUruguayUzbekistanVenezuelaVietnamWest IndiesWestern AfricaWestern AsiaWestern EuropeYemenZaireZimbabweAzores
Immigrants from Egypt
Race
Ancestry
AfghanAfricanAlaska NativeAlaskan AthabascanAlbanianAleutAlsatianAmericanApacheArabArapahoArgentineanArmenianAssyrian/Chaldean/SyriacAustralianAustrianBahamianBangladeshiBarbadianBasqueBelgianBelizeanBermudanBhutaneseBlackfeetBolivianBrazilianBritishBritish West IndianBulgarianBurmeseCajunCambodianCanadianCape VerdeanCarpatho RusynCelticCentral AmericanCentral American IndianCherokeeCheyenneChickasawChileanChineseChippewaChoctawColombianColvilleComancheCosta RicanCreeCreekCroatianCrowCubanCypriotCzechCzechoslovakianDanishDelawareDominicanDutchDutch West IndianEastern EuropeanEcuadorianEgyptianEnglishEstonianEthiopianEuropeanFijianFilipinoFinnishFrenchFrench American IndianFrench CanadianGermanGerman RussianGhanaianGreekGuamanian/ChamorroGuatemalanGuyaneseHaitianHmongHonduranHopiHoumaHungarianIcelanderIndian (Asian)IndonesianInupiatIranianIraqiIrishIroquoisIsraeliItalianJamaicanJapaneseJordanianKenyanKiowaKoreanLaotianLatvianLebaneseLiberianLithuanianLumbeeLuxembourgerMacedonianMalaysianMalteseMarshalleseMenomineeMexicanMexican American IndianMongolianMoroccanNative HawaiianNavajoNepaleseNew ZealanderNigerianNorthern EuropeanNorwegianOkinawanOsageOttawaPaiutePakistaniPalestinianPanamanianParaguayanPennsylvania GermanPeruvianPimaPolishPortuguesePotawatomiPuebloPuerto RicanPuget Sound SalishRomanianRussianSalvadoranSamoanScandinavianScotch-IrishScottishSeminoleSenegaleseSerbianShoshoneSierra LeoneanSiouxSlavicSlovakSloveneSomaliSouth AfricanSouth AmericanSouth American IndianSoviet UnionSpaniardSpanishSpanish AmericanSpanish American IndianSri LankanSubsaharan AfricanSudaneseSwedishSwissSyrianTaiwaneseThaiTlingit-HaidaTohono O'OdhamTonganTrinidadian and TobagonianTsimshianTurkishU.S. Virgin IslanderUgandanUkrainianUruguayanUteVenezuelanVietnameseWelshWest IndianYakamaYaquiYugoslavianYumanYup'ikZimbabwean
Immigration
NonimmigrantsImmigrantsAfghanistanAfricaAlbaniaArgentinaArmeniaAsiaAustraliaAustriaBahamasBangladeshBarbadosBelarusBelgiumBelizeBoliviaBosnia and HerzegovinaBrazilBulgariaBurma/MyanmarCabo VerdeCambodiaCameroonCanadaCaribbeanCentral AmericaChileChinaColombiaCongoCosta RicaCroatiaCubaCzechoslovakiaDenmarkDominicaDominican RepublicEastern AfricaEastern AsiaEastern EuropeEcuadorEgyptEl SalvadorEnglandEritreaEthiopiaEuropeFijiFranceGermanyGhanaGreeceGrenadaGuatemalaGuyanaHaitiHondurasHong KongHungaryIndiaIndonesiaIranIraqIrelandIsraelItalyJamaicaJapanJordanKazakhstanKenyaKoreaKuwaitLaosLatin AmericaLatviaLebanonLiberiaLithuaniaMalaysiaMexicoMicronesiaMiddle AfricaMoldovaMoroccoNepalNetherlandsNicaraguaNigeriaNorth AmericaNorth MacedoniaNorthern AfricaNorthern EuropeNorwayOceaniaPakistanPanamaPeruPhilippinesPolandPortugalRomaniaRussiaSaudi ArabiaScotlandSenegalSerbiaSierra LeoneSingaporeSomaliaSouth AfricaSouth AmericaSouth Central AsiaSouth Eastern AsiaSouthern EuropeSpainSri LankaSt. Vincent and the GrenadinesSudanSwedenSwitzerlandSyriaTaiwanThailandTrinidad and TobagoTurkeyUgandaUkraineUruguayUzbekistanVenezuelaVietnamWest IndiesWestern AfricaWestern AsiaWestern EuropeYemenZaireZimbabweAzores
Median Household Income
Income
Poverty
Unemployment
Labor Participation
Family Structure
Vehicle Availability
Education Level
Disability

Median Household Income Comparison

Nicaraguans

Immigrants from Egypt

Tragic
Exceptional
$79,737
MEDIAN HOUSEHOLD INCOME
3.1/ 100
METRIC RATING
237th/ 347
METRIC RANK
$93,700
MEDIAN HOUSEHOLD INCOME
99.6/ 100
METRIC RATING
73rd/ 347
METRIC RANK

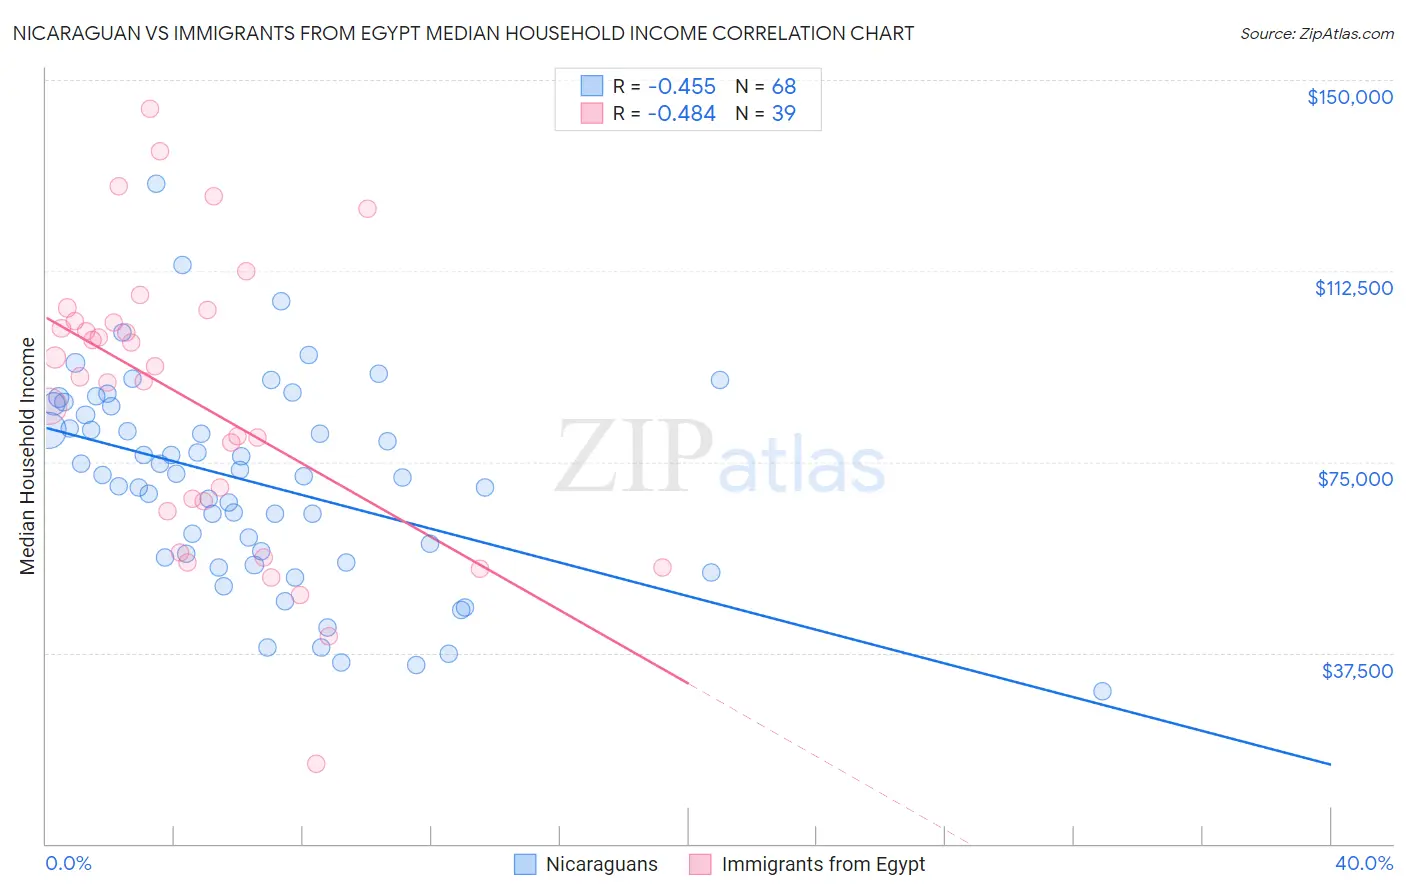
Nicaraguan vs Immigrants from Egypt Median Household Income Correlation Chart

The statistical analysis conducted on geographies consisting of 285,567,751 people shows a moderate negative correlation between the proportion of Nicaraguans and median household income in the United States with a correlation coefficient (R) of -0.455 and weighted average of $79,737. Similarly, the statistical analysis conducted on geographies consisting of 245,403,618 people shows a moderate negative correlation between the proportion of Immigrants from Egypt and median household income in the United States with a correlation coefficient (R) of -0.484 and weighted average of $93,700, a difference of 17.5%.
Nicaraguan vs Immigrants from Egypt Median Household Income

Median Household Income Correlation Summary

MeasurementNicaraguanImmigrants from Egypt
Minimum$29,878$15,682
Maximum$129,595$144,322
Range$99,717$128,640
Mean$70,971$86,856
Median$72,218$91,717
Interquartile 25% (IQ1)$56,639$65,358
Interquartile 75% (IQ3)$85,047$102,559
Interquartile Range (IQR)$28,408$37,201
Standard Deviation (Sample)$19,770$28,300
Standard Deviation (Population)$19,624$27,935

Similar Demographics by Median Household Income

Demographics Similar to Nicaraguans by Median Household Income

In terms of median household income, the demographic groups most similar to Nicaraguans are Barbadian ($79,664, a difference of 0.090%), Immigrants from Bosnia and Herzegovina ($79,888, a difference of 0.19%), Alaska Native ($79,509, a difference of 0.29%), Immigrants from Western Africa ($79,490, a difference of 0.31%), and Nonimmigrants ($79,429, a difference of 0.39%).
DemographicsRating | RankMedian Household Income
Bermudans
4.7
/100
|
#230
Tragic
$80,406
Trinidadians and Tobagonians
4.7
/100
|
#231
Tragic
$80,402
Immigrants | Trinidad and Tobago
4.6
/100
|
#232
Tragic
$80,373
Immigrants | Azores
4.5
/100
|
#233
Tragic
$80,357
Immigrants | Ecuador
4.5
/100
|
#234
Tragic
$80,341
Immigrants | Guyana
4.5
/100
|
#235
Tragic
$80,324
Immigrants | Bosnia and Herzegovina
3.4
/100
|
#236
Tragic
$79,888
Nicaraguans
3.1
/100
|
#237
Tragic
$79,737
Barbadians
3.0
/100
|
#238
Tragic
$79,664
Alaska Natives
2.7
/100
|
#239
Tragic
$79,509
Immigrants | Western Africa
2.7
/100
|
#240
Tragic
$79,490
Immigrants | Nonimmigrants
2.6
/100
|
#241
Tragic
$79,429
Immigrants | Sudan
2.1
/100
|
#242
Tragic
$79,103
Immigrants | Barbados
1.9
/100
|
#243
Tragic
$78,989
Marshallese
1.9
/100
|
#244
Tragic
$78,930

Demographics Similar to Immigrants from Egypt by Median Household Income

In terms of median household income, the demographic groups most similar to Immigrants from Egypt are Immigrants from Latvia ($93,602, a difference of 0.10%), Lithuanian ($93,852, a difference of 0.16%), Immigrants from Philippines ($93,899, a difference of 0.21%), Immigrants from Fiji ($93,933, a difference of 0.25%), and Immigrants from Italy ($93,465, a difference of 0.25%).
DemographicsRating | RankMedian Household Income
Immigrants | Romania
99.7
/100
|
#66
Exceptional
$94,222
Immigrants | Scotland
99.7
/100
|
#67
Exceptional
$94,091
Mongolians
99.7
/100
|
#68
Exceptional
$93,971
Argentineans
99.7
/100
|
#69
Exceptional
$93,960
Immigrants | Fiji
99.7
/100
|
#70
Exceptional
$93,933
Immigrants | Philippines
99.6
/100
|
#71
Exceptional
$93,899
Lithuanians
99.6
/100
|
#72
Exceptional
$93,852
Immigrants | Egypt
99.6
/100
|
#73
Exceptional
$93,700
Immigrants | Latvia
99.6
/100
|
#74
Exceptional
$93,602
Immigrants | Italy
99.5
/100
|
#75
Exceptional
$93,465
South Africans
99.5
/100
|
#76
Exceptional
$93,379
Immigrants | Afghanistan
99.5
/100
|
#77
Exceptional
$93,375
Immigrants | Bulgaria
99.4
/100
|
#78
Exceptional
$93,148
Sri Lankans
99.4
/100
|
#79
Exceptional
$93,093
Tongans
99.4
/100
|
#80
Exceptional
$93,076