Egyptian vs Immigrants from Egypt 11th Grade
COMPARE
Egyptian
Immigrants from Egypt
11th Grade
11th Grade Comparison
Egyptians
Immigrants from Egypt
93.0%
11TH GRADE
89.5/ 100
METRIC RATING
131st/ 347
METRIC RANK
92.8%
11TH GRADE
77.5/ 100
METRIC RATING
150th/ 347
METRIC RANK
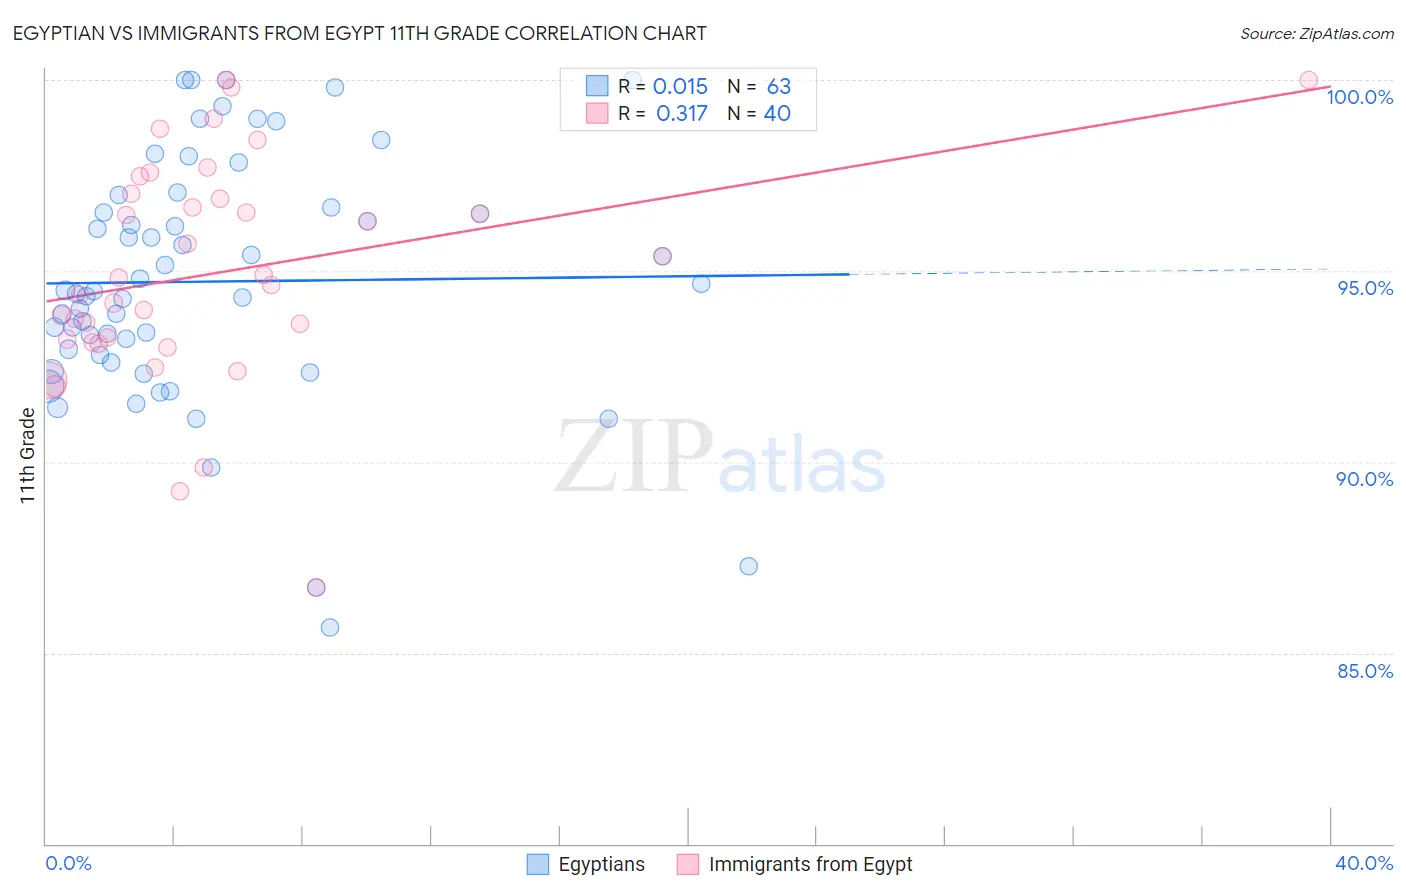
Egyptian vs Immigrants from Egypt 11th Grade Correlation Chart
The statistical analysis conducted on geographies consisting of 276,927,519 people shows no correlation between the proportion of Egyptians and percentage of population with at least 11th grade education in the United States with a correlation coefficient (R) of 0.015 and weighted average of 93.0%. Similarly, the statistical analysis conducted on geographies consisting of 245,484,455 people shows a mild positive correlation between the proportion of Immigrants from Egypt and percentage of population with at least 11th grade education in the United States with a correlation coefficient (R) of 0.317 and weighted average of 92.8%, a difference of 0.22%.
11th Grade Correlation Summary
| Measurement | Egyptian | Immigrants from Egypt |
| Minimum | 85.7% | 86.7% |
| Maximum | 100.0% | 100.0% |
| Range | 14.3% | 13.3% |
| Mean | 94.7% | 95.0% |
| Median | 94.5% | 94.7% |
| Interquartile 25% (IQ1) | 92.8% | 93.2% |
| Interquartile 75% (IQ3) | 96.7% | 97.0% |
| Interquartile Range (IQR) | 3.9% | 3.8% |
| Standard Deviation (Sample) | 3.2% | 2.9% |
| Standard Deviation (Population) | 3.2% | 2.9% |
Demographics Similar to Egyptians and Immigrants from Egypt by 11th Grade
In terms of 11th grade, the demographic groups most similar to Egyptians are Albanian (93.0%, a difference of 0.0%), Immigrants from Bosnia and Herzegovina (93.0%, a difference of 0.010%), Mongolian (93.0%, a difference of 0.050%), Delaware (93.0%, a difference of 0.050%), and Immigrants from Italy (92.9%, a difference of 0.070%). Similarly, the demographic groups most similar to Immigrants from Egypt are Immigrants from Poland (92.8%, a difference of 0.010%), Iroquois (92.8%, a difference of 0.020%), Immigrants from Kenya (92.8%, a difference of 0.020%), Hmong (92.8%, a difference of 0.020%), and Pakistani (92.8%, a difference of 0.030%).
| Demographics | Rating | Rank | 11th Grade |
| Albanians | 89.5 /100 | #130 | Excellent 93.0% |
| Egyptians | 89.5 /100 | #131 | Excellent 93.0% |
| Immigrants | Bosnia and Herzegovina | 89.0 /100 | #132 | Excellent 93.0% |
| Mongolians | 87.6 /100 | #133 | Excellent 93.0% |
| Delaware | 87.3 /100 | #134 | Excellent 93.0% |
| Immigrants | Italy | 86.6 /100 | #135 | Excellent 92.9% |
| Cree | 85.9 /100 | #136 | Excellent 92.9% |
| Arabs | 85.4 /100 | #137 | Excellent 92.9% |
| Immigrants | Brazil | 85.1 /100 | #138 | Excellent 92.9% |
| Crow | 84.1 /100 | #139 | Excellent 92.9% |
| Venezuelans | 83.4 /100 | #140 | Excellent 92.9% |
| Chileans | 83.0 /100 | #141 | Excellent 92.9% |
| Kenyans | 82.0 /100 | #142 | Excellent 92.9% |
| Ugandans | 81.4 /100 | #143 | Excellent 92.9% |
| Assyrians/Chaldeans/Syriacs | 80.5 /100 | #144 | Excellent 92.8% |
| Pakistanis | 79.6 /100 | #145 | Good 92.8% |
| Iroquois | 79.1 /100 | #146 | Good 92.8% |
| Immigrants | Kenya | 78.7 /100 | #147 | Good 92.8% |
| Hmong | 78.6 /100 | #148 | Good 92.8% |
| Immigrants | Poland | 78.5 /100 | #149 | Good 92.8% |
| Immigrants | Egypt | 77.5 /100 | #150 | Good 92.8% |