Egyptian vs Immigrants from Belgium Median Household Income

COMPARE

Egyptian
Race
Ancestry
AfghanAfricanAlaska NativeAlaskan AthabascanAlbanianAleutAlsatianAmericanApacheArabArapahoArgentineanArmenianAssyrian/Chaldean/SyriacAustralianAustrianBahamianBangladeshiBarbadianBasqueBelgianBelizeanBermudanBhutaneseBlackfeetBolivianBrazilianBritishBritish West IndianBulgarianBurmeseCajunCambodianCanadianCape VerdeanCarpatho RusynCelticCentral AmericanCentral American IndianCherokeeCheyenneChickasawChileanChineseChippewaChoctawColombianColvilleComancheCosta RicanCreeCreekCroatianCrowCubanCypriotCzechCzechoslovakianDanishDelawareDominicanDutchDutch West IndianEastern EuropeanEcuadorianEgyptianEnglishEstonianEthiopianEuropeanFijianFilipinoFinnishFrenchFrench American IndianFrench CanadianGermanGerman RussianGhanaianGreekGuamanian/ChamorroGuatemalanGuyaneseHaitianHmongHonduranHopiHoumaHungarianIcelanderIndian (Asian)IndonesianInupiatIranianIraqiIrishIroquoisIsraeliItalianJamaicanJapaneseJordanianKenyanKiowaKoreanLaotianLatvianLebaneseLiberianLithuanianLumbeeLuxembourgerMacedonianMalaysianMalteseMarshalleseMenomineeMexicanMexican American IndianMongolianMoroccanNative HawaiianNavajoNepaleseNew ZealanderNicaraguanNigerianNorthern EuropeanNorwegianOkinawanOsageOttawaPaiutePakistaniPalestinianPanamanianParaguayanPennsylvania GermanPeruvianPimaPolishPortuguesePotawatomiPuebloPuerto RicanPuget Sound SalishRomanianRussianSalvadoranSamoanScandinavianScotch-IrishScottishSeminoleSenegaleseSerbianShoshoneSierra LeoneanSiouxSlavicSlovakSloveneSomaliSouth AfricanSouth AmericanSouth American IndianSoviet UnionSpaniardSpanishSpanish AmericanSpanish American IndianSri LankanSubsaharan AfricanSudaneseSwedishSwissSyrianTaiwaneseThaiTlingit-HaidaTohono O'OdhamTonganTrinidadian and TobagonianTsimshianTurkishU.S. Virgin IslanderUgandanUkrainianUruguayanUteVenezuelanVietnameseWelshWest IndianYakamaYaquiYugoslavianYumanYup'ikZimbabwean
Immigration
NonimmigrantsImmigrantsAfghanistanAfricaAlbaniaArgentinaArmeniaAsiaAustraliaAustriaBahamasBangladeshBarbadosBelarusBelizeBoliviaBosnia and HerzegovinaBrazilBulgariaBurma/MyanmarCabo VerdeCambodiaCameroonCanadaCaribbeanCentral AmericaChileChinaColombiaCongoCosta RicaCroatiaCubaCzechoslovakiaDenmarkDominicaDominican RepublicEastern AfricaEastern AsiaEastern EuropeEcuadorEgyptEl SalvadorEnglandEritreaEthiopiaEuropeFijiFranceGermanyGhanaGreeceGrenadaGuatemalaGuyanaHaitiHondurasHong KongHungaryIndiaIndonesiaIranIraqIrelandIsraelItalyJamaicaJapanJordanKazakhstanKenyaKoreaKuwaitLaosLatin AmericaLatviaLebanonLiberiaLithuaniaMalaysiaMexicoMicronesiaMiddle AfricaMoldovaMoroccoNepalNetherlandsNicaraguaNigeriaNorth AmericaNorth MacedoniaNorthern AfricaNorthern EuropeNorwayOceaniaPakistanPanamaPeruPhilippinesPolandPortugalRomaniaRussiaSaudi ArabiaScotlandSenegalSerbiaSierra LeoneSingaporeSomaliaSouth AfricaSouth AmericaSouth Central AsiaSouth Eastern AsiaSouthern EuropeSpainSri LankaSt. Vincent and the GrenadinesSudanSwedenSwitzerlandSyriaTaiwanThailandTrinidad and TobagoTurkeyUgandaUkraineUruguayUzbekistanVenezuelaVietnamWest IndiesWestern AfricaWestern AsiaWestern EuropeYemenZaireZimbabweAzores
Immigrants from Belgium
Race
Ancestry
AfghanAfricanAlaska NativeAlaskan AthabascanAlbanianAleutAlsatianAmericanApacheArabArapahoArgentineanArmenianAssyrian/Chaldean/SyriacAustralianAustrianBahamianBangladeshiBarbadianBasqueBelgianBelizeanBermudanBhutaneseBlackfeetBolivianBrazilianBritishBritish West IndianBulgarianBurmeseCajunCambodianCanadianCape VerdeanCarpatho RusynCelticCentral AmericanCentral American IndianCherokeeCheyenneChickasawChileanChineseChippewaChoctawColombianColvilleComancheCosta RicanCreeCreekCroatianCrowCubanCypriotCzechCzechoslovakianDanishDelawareDominicanDutchDutch West IndianEastern EuropeanEcuadorianEnglishEstonianEthiopianEuropeanFijianFilipinoFinnishFrenchFrench American IndianFrench CanadianGermanGerman RussianGhanaianGreekGuamanian/ChamorroGuatemalanGuyaneseHaitianHmongHonduranHopiHoumaHungarianIcelanderIndian (Asian)IndonesianInupiatIranianIraqiIrishIroquoisIsraeliItalianJamaicanJapaneseJordanianKenyanKiowaKoreanLaotianLatvianLebaneseLiberianLithuanianLumbeeLuxembourgerMacedonianMalaysianMalteseMarshalleseMenomineeMexicanMexican American IndianMongolianMoroccanNative HawaiianNavajoNepaleseNew ZealanderNicaraguanNigerianNorthern EuropeanNorwegianOkinawanOsageOttawaPaiutePakistaniPalestinianPanamanianParaguayanPennsylvania GermanPeruvianPimaPolishPortuguesePotawatomiPuebloPuerto RicanPuget Sound SalishRomanianRussianSalvadoranSamoanScandinavianScotch-IrishScottishSeminoleSenegaleseSerbianShoshoneSierra LeoneanSiouxSlavicSlovakSloveneSomaliSouth AfricanSouth AmericanSouth American IndianSoviet UnionSpaniardSpanishSpanish AmericanSpanish American IndianSri LankanSubsaharan AfricanSudaneseSwedishSwissSyrianTaiwaneseThaiTlingit-HaidaTohono O'OdhamTonganTrinidadian and TobagonianTsimshianTurkishU.S. Virgin IslanderUgandanUkrainianUruguayanUteVenezuelanVietnameseWelshWest IndianYakamaYaquiYugoslavianYumanYup'ikZimbabwean
Immigration
NonimmigrantsImmigrantsAfghanistanAfricaAlbaniaArgentinaArmeniaAsiaAustraliaAustriaBahamasBangladeshBarbadosBelarusBelgiumBelizeBoliviaBosnia and HerzegovinaBrazilBulgariaBurma/MyanmarCabo VerdeCambodiaCameroonCanadaCaribbeanCentral AmericaChileChinaColombiaCongoCosta RicaCroatiaCubaCzechoslovakiaDenmarkDominicaDominican RepublicEastern AfricaEastern AsiaEastern EuropeEcuadorEgyptEl SalvadorEnglandEritreaEthiopiaEuropeFijiFranceGermanyGhanaGreeceGrenadaGuatemalaGuyanaHaitiHondurasHong KongHungaryIndiaIndonesiaIranIraqIrelandIsraelItalyJamaicaJapanJordanKazakhstanKenyaKoreaKuwaitLaosLatin AmericaLatviaLebanonLiberiaLithuaniaMalaysiaMexicoMicronesiaMiddle AfricaMoldovaMoroccoNepalNetherlandsNicaraguaNigeriaNorth AmericaNorth MacedoniaNorthern AfricaNorthern EuropeNorwayOceaniaPakistanPanamaPeruPhilippinesPolandPortugalRomaniaRussiaSaudi ArabiaScotlandSenegalSerbiaSierra LeoneSingaporeSomaliaSouth AfricaSouth AmericaSouth Central AsiaSouth Eastern AsiaSouthern EuropeSpainSri LankaSt. Vincent and the GrenadinesSudanSwedenSwitzerlandSyriaTaiwanThailandTrinidad and TobagoTurkeyUgandaUkraineUruguayUzbekistanVenezuelaVietnamWest IndiesWestern AfricaWestern AsiaWestern EuropeYemenZaireZimbabweAzores
Median Household Income
Income
Poverty
Unemployment
Labor Participation
Family Structure
Vehicle Availability
Education Level
Disability

Median Household Income Comparison

Egyptians

Immigrants from Belgium

Exceptional
Exceptional
$95,673
MEDIAN HOUSEHOLD INCOME
99.9/ 100
METRIC RATING
54th/ 347
METRIC RANK
$100,306
MEDIAN HOUSEHOLD INCOME
100.0/ 100
METRIC RATING
26th/ 347
METRIC RANK

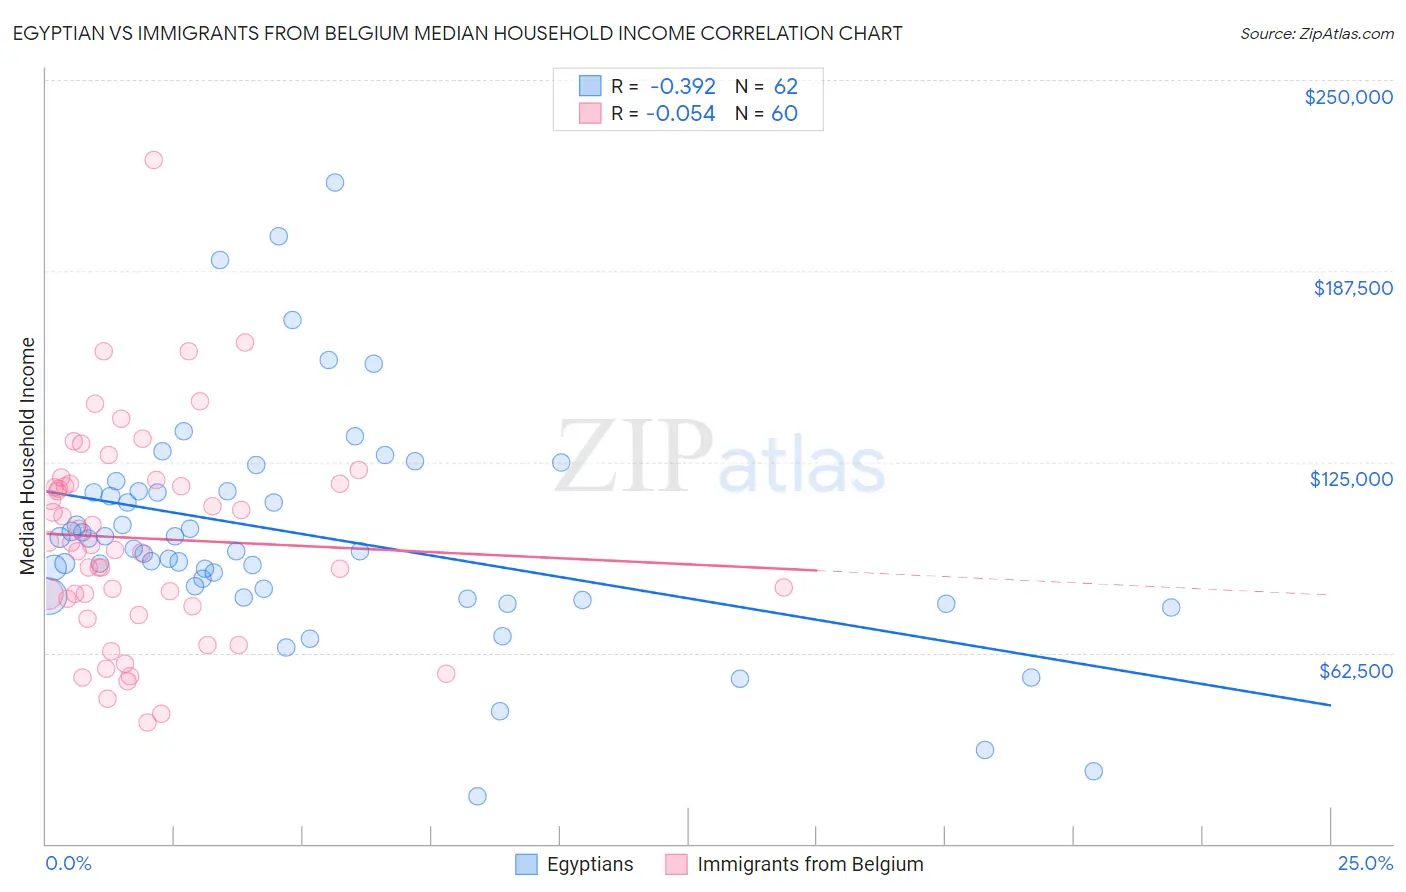
Egyptian vs Immigrants from Belgium Median Household Income Correlation Chart

The statistical analysis conducted on geographies consisting of 276,717,695 people shows a mild negative correlation between the proportion of Egyptians and median household income in the United States with a correlation coefficient (R) of -0.392 and weighted average of $95,673. Similarly, the statistical analysis conducted on geographies consisting of 146,650,493 people shows a slight negative correlation between the proportion of Immigrants from Belgium and median household income in the United States with a correlation coefficient (R) of -0.054 and weighted average of $100,306, a difference of 4.8%.
Egyptian vs Immigrants from Belgium Median Household Income

Median Household Income Correlation Summary

MeasurementEgyptianImmigrants from Belgium
Minimum$15,682$39,542
Maximum$216,495$223,750
Range$200,813$184,208
Mean$100,993$99,959
Median$96,117$98,272
Interquartile 25% (IQ1)$81,164$78,898
Interquartile 75% (IQ3)$115,184$117,778
Interquartile Range (IQR)$34,020$38,881
Standard Deviation (Sample)$37,055$34,343
Standard Deviation (Population)$36,755$34,056

Similar Demographics by Median Household Income

Demographics Similar to Egyptians by Median Household Income

In terms of median household income, the demographic groups most similar to Egyptians are Paraguayan ($95,737, a difference of 0.070%), Immigrants from South Africa ($95,800, a difference of 0.13%), Estonian ($95,930, a difference of 0.27%), Immigrants from Czechoslovakia ($95,319, a difference of 0.37%), and Immigrants from Austria ($95,277, a difference of 0.42%).
DemographicsRating | RankMedian Household Income
Immigrants | Russia
99.9
/100
|
#47
Exceptional
$96,378
Cambodians
99.9
/100
|
#48
Exceptional
$96,324
Immigrants | Malaysia
99.9
/100
|
#49
Exceptional
$96,292
Bulgarians
99.9
/100
|
#50
Exceptional
$96,290
Estonians
99.9
/100
|
#51
Exceptional
$95,930
Immigrants | South Africa
99.9
/100
|
#52
Exceptional
$95,800
Paraguayans
99.9
/100
|
#53
Exceptional
$95,737
Egyptians
99.9
/100
|
#54
Exceptional
$95,673
Immigrants | Czechoslovakia
99.9
/100
|
#55
Exceptional
$95,319
Immigrants | Austria
99.9
/100
|
#56
Exceptional
$95,277
New Zealanders
99.8
/100
|
#57
Exceptional
$95,146
Soviet Union
99.8
/100
|
#58
Exceptional
$95,098
Immigrants | Europe
99.8
/100
|
#59
Exceptional
$95,032
Koreans
99.8
/100
|
#60
Exceptional
$95,018
Laotians
99.8
/100
|
#61
Exceptional
$94,990

Demographics Similar to Immigrants from Belgium by Median Household Income

In terms of median household income, the demographic groups most similar to Immigrants from Belgium are Bhutanese ($100,151, a difference of 0.15%), Immigrants from Sri Lanka ($99,943, a difference of 0.36%), Immigrants from Asia ($99,933, a difference of 0.37%), Immigrants from Sweden ($100,699, a difference of 0.39%), and Immigrants from Japan ($100,711, a difference of 0.40%).
DemographicsRating | RankMedian Household Income
Immigrants | Australia
100.0
/100
|
#19
Exceptional
$102,562
Bolivians
100.0
/100
|
#20
Exceptional
$102,195
Eastern Europeans
100.0
/100
|
#21
Exceptional
$101,781
Asians
100.0
/100
|
#22
Exceptional
$101,681
Immigrants | Bolivia
100.0
/100
|
#23
Exceptional
$101,394
Immigrants | Japan
100.0
/100
|
#24
Exceptional
$100,711
Immigrants | Sweden
100.0
/100
|
#25
Exceptional
$100,699
Immigrants | Belgium
100.0
/100
|
#26
Exceptional
$100,306
Bhutanese
100.0
/100
|
#27
Exceptional
$100,151
Immigrants | Sri Lanka
100.0
/100
|
#28
Exceptional
$99,943
Immigrants | Asia
100.0
/100
|
#29
Exceptional
$99,933
Immigrants | Northern Europe
100.0
/100
|
#30
Exceptional
$99,813
Turks
100.0
/100
|
#31
Exceptional
$99,389
Immigrants | Denmark
100.0
/100
|
#32
Exceptional
$98,510
Chinese
100.0
/100
|
#33
Exceptional
$98,496