Egyptian vs West Indian Median Household Income
COMPARE
Egyptian
West Indian
Median Household Income
Median Household Income Comparison
Egyptians
West Indians
$95,673
MEDIAN HOUSEHOLD INCOME
99.9/ 100
METRIC RATING
54th/ 347
METRIC RANK
$78,455
MEDIAN HOUSEHOLD INCOME
1.4/ 100
METRIC RATING
249th/ 347
METRIC RANK
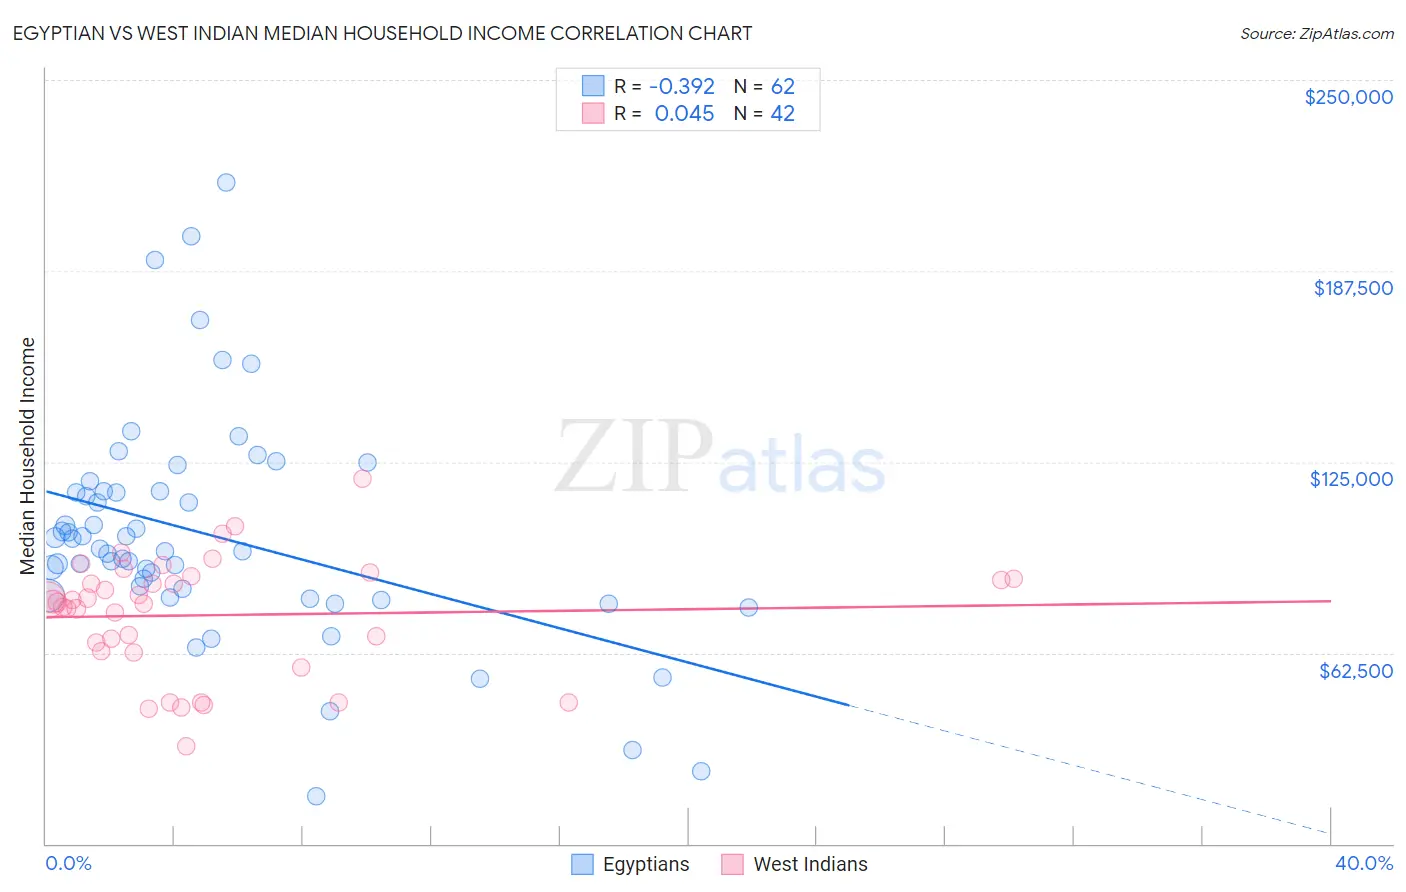
Egyptian vs West Indian Median Household Income Correlation Chart
The statistical analysis conducted on geographies consisting of 276,717,695 people shows a mild negative correlation between the proportion of Egyptians and median household income in the United States with a correlation coefficient (R) of -0.392 and weighted average of $95,673. Similarly, the statistical analysis conducted on geographies consisting of 253,821,014 people shows no correlation between the proportion of West Indians and median household income in the United States with a correlation coefficient (R) of 0.045 and weighted average of $78,455, a difference of 22.0%.
Median Household Income Correlation Summary
| Measurement | Egyptian | West Indian |
| Minimum | $15,682 | $31,916 |
| Maximum | $216,495 | $119,474 |
| Range | $200,813 | $87,558 |
| Mean | $100,993 | $74,809 |
| Median | $96,117 | $79,024 |
| Interquartile 25% (IQ1) | $81,164 | $62,987 |
| Interquartile 75% (IQ3) | $115,184 | $86,556 |
| Interquartile Range (IQR) | $34,020 | $23,569 |
| Standard Deviation (Sample) | $37,055 | $19,069 |
| Standard Deviation (Population) | $36,755 | $18,840 |
Similar Demographics by Median Household Income
Demographics Similar to Egyptians by Median Household Income
In terms of median household income, the demographic groups most similar to Egyptians are Paraguayan ($95,737, a difference of 0.070%), Immigrants from South Africa ($95,800, a difference of 0.13%), Estonian ($95,930, a difference of 0.27%), Immigrants from Czechoslovakia ($95,319, a difference of 0.37%), and Immigrants from Austria ($95,277, a difference of 0.42%).
| Demographics | Rating | Rank | Median Household Income |
| Immigrants | Russia | 99.9 /100 | #47 | Exceptional $96,378 |
| Cambodians | 99.9 /100 | #48 | Exceptional $96,324 |
| Immigrants | Malaysia | 99.9 /100 | #49 | Exceptional $96,292 |
| Bulgarians | 99.9 /100 | #50 | Exceptional $96,290 |
| Estonians | 99.9 /100 | #51 | Exceptional $95,930 |
| Immigrants | South Africa | 99.9 /100 | #52 | Exceptional $95,800 |
| Paraguayans | 99.9 /100 | #53 | Exceptional $95,737 |
| Egyptians | 99.9 /100 | #54 | Exceptional $95,673 |
| Immigrants | Czechoslovakia | 99.9 /100 | #55 | Exceptional $95,319 |
| Immigrants | Austria | 99.9 /100 | #56 | Exceptional $95,277 |
| New Zealanders | 99.8 /100 | #57 | Exceptional $95,146 |
| Soviet Union | 99.8 /100 | #58 | Exceptional $95,098 |
| Immigrants | Europe | 99.8 /100 | #59 | Exceptional $95,032 |
| Koreans | 99.8 /100 | #60 | Exceptional $95,018 |
| Laotians | 99.8 /100 | #61 | Exceptional $94,990 |
Demographics Similar to West Indians by Median Household Income
In terms of median household income, the demographic groups most similar to West Indians are Sudanese ($78,529, a difference of 0.090%), Immigrants from Laos ($78,327, a difference of 0.16%), Immigrants from Burma/Myanmar ($78,682, a difference of 0.29%), Mexican American Indian ($78,166, a difference of 0.37%), and Central American ($78,803, a difference of 0.44%).
| Demographics | Rating | Rank | Median Household Income |
| Immigrants | Sudan | 2.1 /100 | #242 | Tragic $79,103 |
| Immigrants | Barbados | 1.9 /100 | #243 | Tragic $78,989 |
| Marshallese | 1.9 /100 | #244 | Tragic $78,930 |
| Inupiat | 1.8 /100 | #245 | Tragic $78,841 |
| Central Americans | 1.7 /100 | #246 | Tragic $78,803 |
| Immigrants | Burma/Myanmar | 1.6 /100 | #247 | Tragic $78,682 |
| Sudanese | 1.5 /100 | #248 | Tragic $78,529 |
| West Indians | 1.4 /100 | #249 | Tragic $78,455 |
| Immigrants | Laos | 1.3 /100 | #250 | Tragic $78,327 |
| Mexican American Indians | 1.2 /100 | #251 | Tragic $78,166 |
| Immigrants | West Indies | 1.0 /100 | #252 | Tragic $77,956 |
| Immigrants | St. Vincent and the Grenadines | 0.9 /100 | #253 | Tragic $77,690 |
| Sub-Saharan Africans | 0.8 /100 | #254 | Tragic $77,631 |
| Immigrants | Middle Africa | 0.8 /100 | #255 | Tragic $77,559 |
| Belizeans | 0.6 /100 | #256 | Tragic $77,028 |