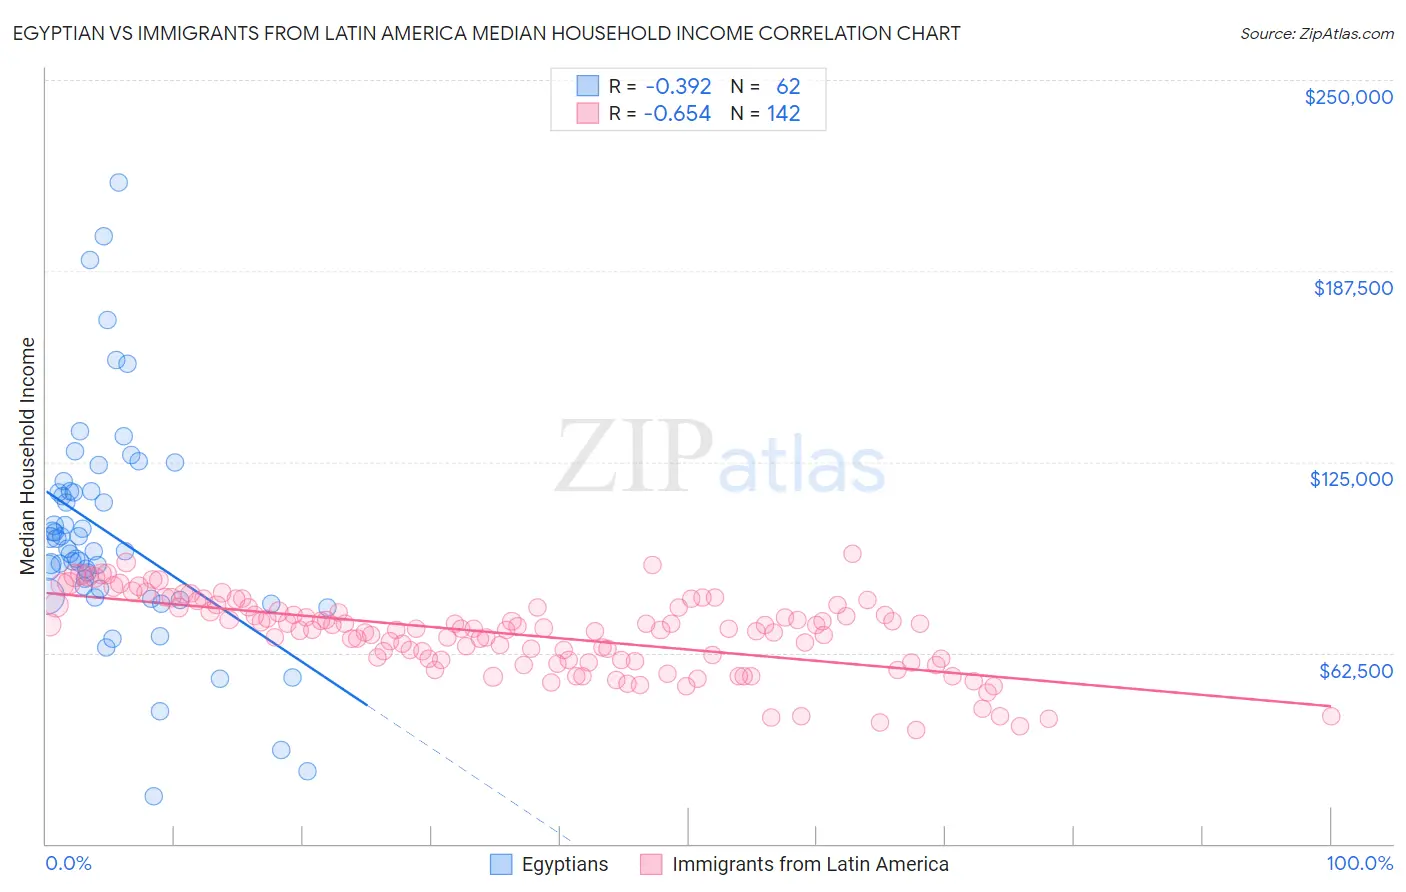
Egyptian vs Immigrants from Latin America Median Household Income
COMPARE
Egyptian
Immigrants from Latin America
Median Household Income
Median Household Income Comparison
Egyptians
Immigrants from Latin America
$95,673
MEDIAN HOUSEHOLD INCOME
99.9/ 100
METRIC RATING
54th/ 347
METRIC RANK
$75,420
MEDIAN HOUSEHOLD INCOME
0.2/ 100
METRIC RATING
276th/ 347
METRIC RANK
Egyptian vs Immigrants from Latin America Median Household Income Correlation Chart
The statistical analysis conducted on geographies consisting of 276,717,695 people shows a mild negative correlation between the proportion of Egyptians and median household income in the United States with a correlation coefficient (R) of -0.392 and weighted average of $95,673. Similarly, the statistical analysis conducted on geographies consisting of 557,585,131 people shows a significant negative correlation between the proportion of Immigrants from Latin America and median household income in the United States with a correlation coefficient (R) of -0.654 and weighted average of $75,420, a difference of 26.9%.
Median Household Income Correlation Summary
| Measurement | Egyptian | Immigrants from Latin America |
| Minimum | $15,682 | $37,370 |
| Maximum | $216,495 | $94,905 |
| Range | $200,813 | $57,535 |
| Mean | $100,993 | $68,616 |
| Median | $96,117 | $70,288 |
| Interquartile 25% (IQ1) | $81,164 | $60,228 |
| Interquartile 75% (IQ3) | $115,184 | $77,376 |
| Interquartile Range (IQR) | $34,020 | $17,148 |
| Standard Deviation (Sample) | $37,055 | $12,455 |
| Standard Deviation (Population) | $36,755 | $12,411 |
Similar Demographics by Median Household Income
Demographics Similar to Egyptians by Median Household Income
In terms of median household income, the demographic groups most similar to Egyptians are Paraguayan ($95,737, a difference of 0.070%), Immigrants from South Africa ($95,800, a difference of 0.13%), Estonian ($95,930, a difference of 0.27%), Immigrants from Czechoslovakia ($95,319, a difference of 0.37%), and Immigrants from Austria ($95,277, a difference of 0.42%).
| Demographics | Rating | Rank | Median Household Income |
| Immigrants | Russia | 99.9 /100 | #47 | Exceptional $96,378 |
| Cambodians | 99.9 /100 | #48 | Exceptional $96,324 |
| Immigrants | Malaysia | 99.9 /100 | #49 | Exceptional $96,292 |
| Bulgarians | 99.9 /100 | #50 | Exceptional $96,290 |
| Estonians | 99.9 /100 | #51 | Exceptional $95,930 |
| Immigrants | South Africa | 99.9 /100 | #52 | Exceptional $95,800 |
| Paraguayans | 99.9 /100 | #53 | Exceptional $95,737 |
| Egyptians | 99.9 /100 | #54 | Exceptional $95,673 |
| Immigrants | Czechoslovakia | 99.9 /100 | #55 | Exceptional $95,319 |
| Immigrants | Austria | 99.9 /100 | #56 | Exceptional $95,277 |
| New Zealanders | 99.8 /100 | #57 | Exceptional $95,146 |
| Soviet Union | 99.8 /100 | #58 | Exceptional $95,098 |
| Immigrants | Europe | 99.8 /100 | #59 | Exceptional $95,032 |
| Koreans | 99.8 /100 | #60 | Exceptional $95,018 |
| Laotians | 99.8 /100 | #61 | Exceptional $94,990 |
Demographics Similar to Immigrants from Latin America by Median Household Income
In terms of median household income, the demographic groups most similar to Immigrants from Latin America are Spanish American ($75,386, a difference of 0.040%), Immigrants from Micronesia ($75,574, a difference of 0.20%), Osage ($75,240, a difference of 0.24%), British West Indian ($75,647, a difference of 0.30%), and Liberian ($75,667, a difference of 0.33%).
| Demographics | Rating | Rank | Median Household Income |
| Cape Verdeans | 0.3 /100 | #269 | Tragic $75,848 |
| Hmong | 0.3 /100 | #270 | Tragic $75,839 |
| Pennsylvania Germans | 0.3 /100 | #271 | Tragic $75,814 |
| Somalis | 0.3 /100 | #272 | Tragic $75,782 |
| Liberians | 0.2 /100 | #273 | Tragic $75,667 |
| British West Indians | 0.2 /100 | #274 | Tragic $75,647 |
| Immigrants | Micronesia | 0.2 /100 | #275 | Tragic $75,574 |
| Immigrants | Latin America | 0.2 /100 | #276 | Tragic $75,420 |
| Spanish Americans | 0.2 /100 | #277 | Tragic $75,386 |
| Osage | 0.2 /100 | #278 | Tragic $75,240 |
| Immigrants | Guatemala | 0.2 /100 | #279 | Tragic $75,123 |
| Senegalese | 0.2 /100 | #280 | Tragic $74,999 |
| Immigrants | Liberia | 0.1 /100 | #281 | Tragic $74,896 |
| Central American Indians | 0.1 /100 | #282 | Tragic $74,847 |
| Cree | 0.1 /100 | #283 | Tragic $74,685 |