Paiute vs Immigrants from Egypt Median Household Income
COMPARE
Paiute
Immigrants from Egypt
Median Household Income
Median Household Income Comparison
Paiute
Immigrants from Egypt
$72,959
MEDIAN HOUSEHOLD INCOME
0.0/ 100
METRIC RATING
298th/ 347
METRIC RANK
$93,700
MEDIAN HOUSEHOLD INCOME
99.6/ 100
METRIC RATING
73rd/ 347
METRIC RANK
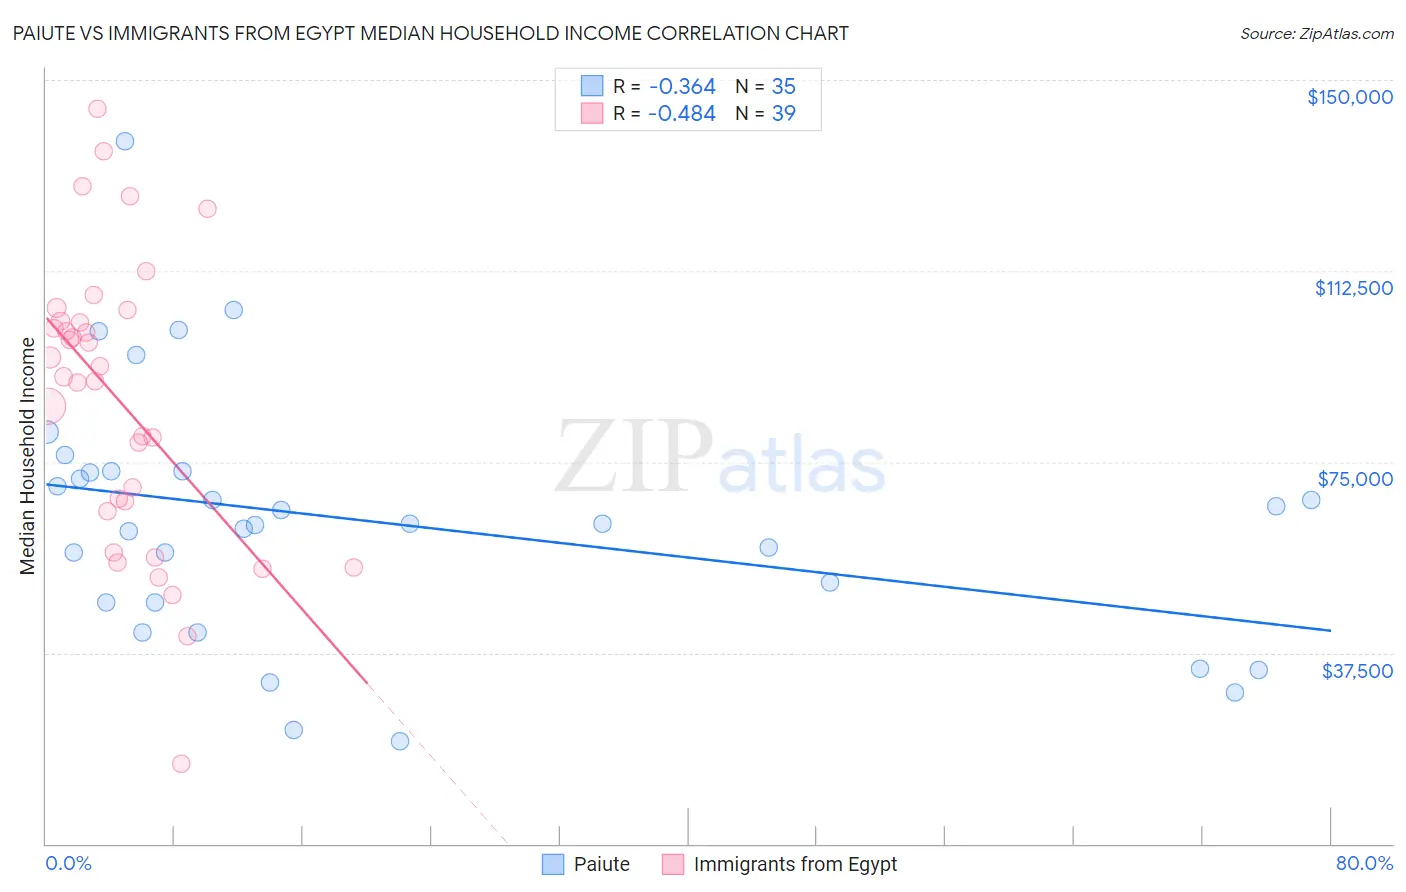
Paiute vs Immigrants from Egypt Median Household Income Correlation Chart
The statistical analysis conducted on geographies consisting of 58,395,139 people shows a mild negative correlation between the proportion of Paiute and median household income in the United States with a correlation coefficient (R) of -0.364 and weighted average of $72,959. Similarly, the statistical analysis conducted on geographies consisting of 245,403,618 people shows a moderate negative correlation between the proportion of Immigrants from Egypt and median household income in the United States with a correlation coefficient (R) of -0.484 and weighted average of $93,700, a difference of 28.4%.
Median Household Income Correlation Summary
| Measurement | Paiute | Immigrants from Egypt |
| Minimum | $20,139 | $15,682 |
| Maximum | $138,043 | $144,322 |
| Range | $117,904 | $128,640 |
| Mean | $63,163 | $86,856 |
| Median | $62,760 | $91,717 |
| Interquartile 25% (IQ1) | $47,361 | $65,358 |
| Interquartile 75% (IQ3) | $73,101 | $102,559 |
| Interquartile Range (IQR) | $25,740 | $37,201 |
| Standard Deviation (Sample) | $24,968 | $28,300 |
| Standard Deviation (Population) | $24,608 | $27,935 |
Similar Demographics by Median Household Income
Demographics Similar to Paiute by Median Household Income
In terms of median household income, the demographic groups most similar to Paiute are Indonesian ($72,856, a difference of 0.14%), Immigrants from Mexico ($73,160, a difference of 0.27%), Immigrants from Dominica ($72,760, a difference of 0.27%), Cherokee ($72,682, a difference of 0.38%), and Shoshone ($72,660, a difference of 0.41%).
| Demographics | Rating | Rank | Median Household Income |
| Hispanics or Latinos | 0.1 /100 | #291 | Tragic $73,823 |
| Comanche | 0.1 /100 | #292 | Tragic $73,747 |
| Immigrants | Cabo Verde | 0.1 /100 | #293 | Tragic $73,515 |
| Blackfeet | 0.1 /100 | #294 | Tragic $73,509 |
| Cubans | 0.1 /100 | #295 | Tragic $73,392 |
| Haitians | 0.1 /100 | #296 | Tragic $73,306 |
| Immigrants | Mexico | 0.0 /100 | #297 | Tragic $73,160 |
| Paiute | 0.0 /100 | #298 | Tragic $72,959 |
| Indonesians | 0.0 /100 | #299 | Tragic $72,856 |
| Immigrants | Dominica | 0.0 /100 | #300 | Tragic $72,760 |
| Cherokee | 0.0 /100 | #301 | Tragic $72,682 |
| Shoshone | 0.0 /100 | #302 | Tragic $72,660 |
| Africans | 0.0 /100 | #303 | Tragic $72,650 |
| Immigrants | Haiti | 0.0 /100 | #304 | Tragic $72,599 |
| Hondurans | 0.0 /100 | #305 | Tragic $72,588 |
Demographics Similar to Immigrants from Egypt by Median Household Income
In terms of median household income, the demographic groups most similar to Immigrants from Egypt are Immigrants from Latvia ($93,602, a difference of 0.10%), Lithuanian ($93,852, a difference of 0.16%), Immigrants from Philippines ($93,899, a difference of 0.21%), Immigrants from Fiji ($93,933, a difference of 0.25%), and Immigrants from Italy ($93,465, a difference of 0.25%).
| Demographics | Rating | Rank | Median Household Income |
| Immigrants | Romania | 99.7 /100 | #66 | Exceptional $94,222 |
| Immigrants | Scotland | 99.7 /100 | #67 | Exceptional $94,091 |
| Mongolians | 99.7 /100 | #68 | Exceptional $93,971 |
| Argentineans | 99.7 /100 | #69 | Exceptional $93,960 |
| Immigrants | Fiji | 99.7 /100 | #70 | Exceptional $93,933 |
| Immigrants | Philippines | 99.6 /100 | #71 | Exceptional $93,899 |
| Lithuanians | 99.6 /100 | #72 | Exceptional $93,852 |
| Immigrants | Egypt | 99.6 /100 | #73 | Exceptional $93,700 |
| Immigrants | Latvia | 99.6 /100 | #74 | Exceptional $93,602 |
| Immigrants | Italy | 99.5 /100 | #75 | Exceptional $93,465 |
| South Africans | 99.5 /100 | #76 | Exceptional $93,379 |
| Immigrants | Afghanistan | 99.5 /100 | #77 | Exceptional $93,375 |
| Immigrants | Bulgaria | 99.4 /100 | #78 | Exceptional $93,148 |
| Sri Lankans | 99.4 /100 | #79 | Exceptional $93,093 |
| Tongans | 99.4 /100 | #80 | Exceptional $93,076 |