Ecuadorian vs Immigrants from North Macedonia Median Family Income
COMPARE
Ecuadorian
Immigrants from North Macedonia
Median Family Income
Median Family Income Comparison
Ecuadorians
Immigrants from North Macedonia
$95,114
MEDIAN FAMILY INCOME
2.1/ 100
METRIC RATING
231st/ 347
METRIC RANK
$109,136
MEDIAN FAMILY INCOME
96.4/ 100
METRIC RATING
107th/ 347
METRIC RANK
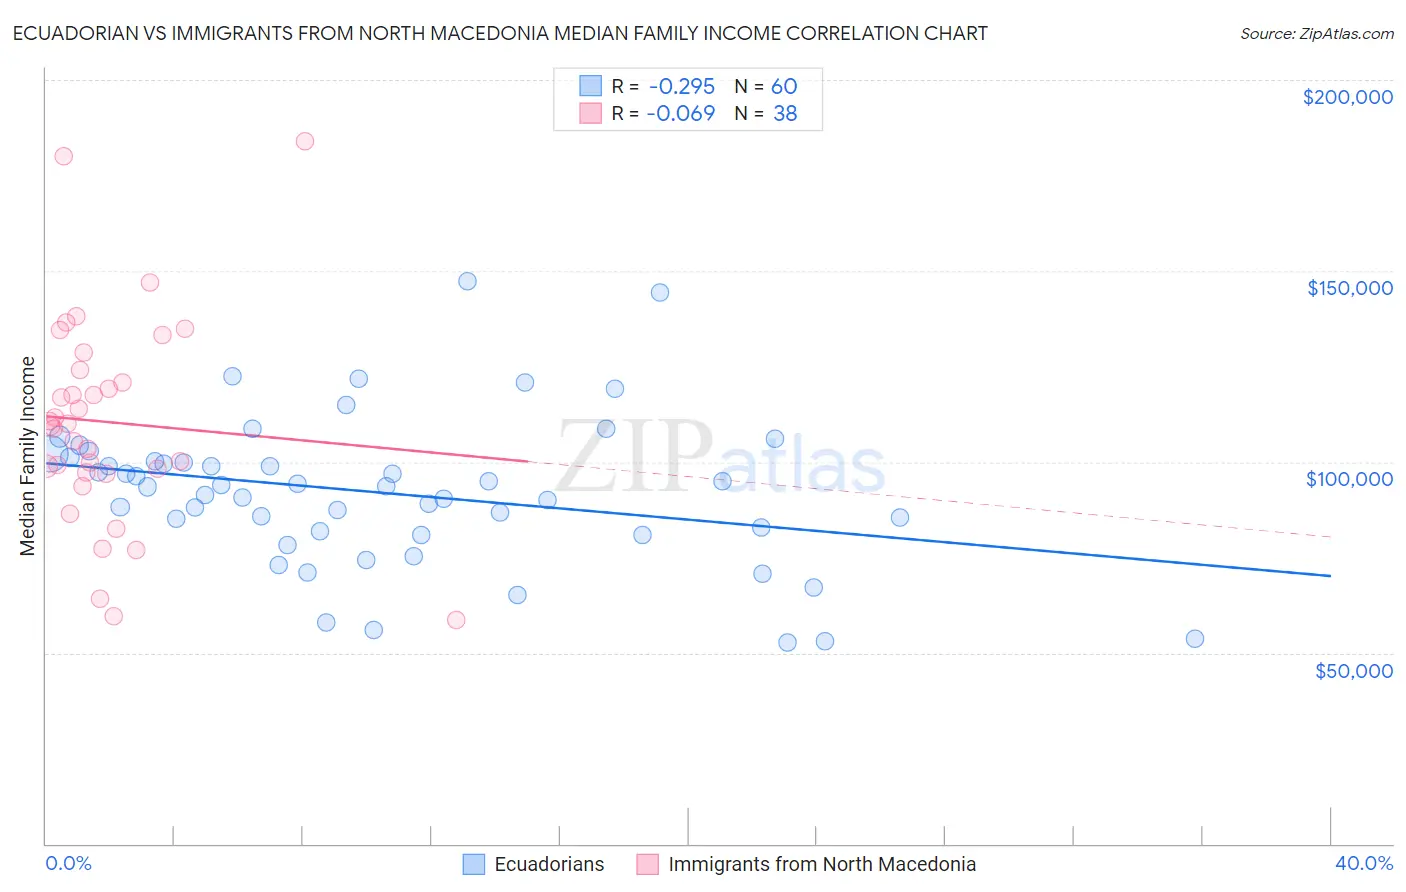
Ecuadorian vs Immigrants from North Macedonia Median Family Income Correlation Chart
The statistical analysis conducted on geographies consisting of 317,539,775 people shows a weak negative correlation between the proportion of Ecuadorians and median family income in the United States with a correlation coefficient (R) of -0.295 and weighted average of $95,114. Similarly, the statistical analysis conducted on geographies consisting of 74,300,796 people shows a slight negative correlation between the proportion of Immigrants from North Macedonia and median family income in the United States with a correlation coefficient (R) of -0.069 and weighted average of $109,136, a difference of 14.7%.
Median Family Income Correlation Summary
| Measurement | Ecuadorian | Immigrants from North Macedonia |
| Minimum | $52,846 | $58,625 |
| Maximum | $147,371 | $184,091 |
| Range | $94,525 | $125,466 |
| Mean | $91,870 | $110,416 |
| Median | $93,530 | $109,646 |
| Interquartile 25% (IQ1) | $81,441 | $97,322 |
| Interquartile 75% (IQ3) | $100,588 | $124,196 |
| Interquartile Range (IQR) | $19,147 | $26,874 |
| Standard Deviation (Sample) | $19,583 | $27,502 |
| Standard Deviation (Population) | $19,420 | $27,137 |
Similar Demographics by Median Family Income
Demographics Similar to Ecuadorians by Median Family Income
In terms of median family income, the demographic groups most similar to Ecuadorians are Malaysian ($95,230, a difference of 0.12%), Marshallese ($95,293, a difference of 0.19%), Immigrants from Venezuela ($94,904, a difference of 0.22%), Immigrants from the Azores ($95,402, a difference of 0.30%), and Immigrants from Bangladesh ($94,665, a difference of 0.47%).
| Demographics | Rating | Rank | Median Family Income |
| Immigrants | Nonimmigrants | 3.6 /100 | #224 | Tragic $96,231 |
| Vietnamese | 3.4 /100 | #225 | Tragic $96,123 |
| Immigrants | Panama | 2.7 /100 | #226 | Tragic $95,647 |
| Alaska Natives | 2.6 /100 | #227 | Tragic $95,573 |
| Immigrants | Azores | 2.4 /100 | #228 | Tragic $95,402 |
| Marshallese | 2.2 /100 | #229 | Tragic $95,293 |
| Malaysians | 2.2 /100 | #230 | Tragic $95,230 |
| Ecuadorians | 2.1 /100 | #231 | Tragic $95,114 |
| Immigrants | Venezuela | 1.9 /100 | #232 | Tragic $94,904 |
| Immigrants | Bangladesh | 1.6 /100 | #233 | Tragic $94,665 |
| Immigrants | Western Africa | 1.6 /100 | #234 | Tragic $94,638 |
| Immigrants | Burma/Myanmar | 1.5 /100 | #235 | Tragic $94,472 |
| Trinidadians and Tobagonians | 1.5 /100 | #236 | Tragic $94,466 |
| Alaskan Athabascans | 1.5 /100 | #237 | Tragic $94,429 |
| Nepalese | 1.3 /100 | #238 | Tragic $94,153 |
Demographics Similar to Immigrants from North Macedonia by Median Family Income
In terms of median family income, the demographic groups most similar to Immigrants from North Macedonia are Albanian ($109,136, a difference of 0.0%), Syrian ($109,299, a difference of 0.15%), Palestinian ($109,413, a difference of 0.25%), Immigrants from Brazil ($109,418, a difference of 0.26%), and Immigrants from Zimbabwe ($108,830, a difference of 0.28%).
| Demographics | Rating | Rank | Median Family Income |
| Macedonians | 97.3 /100 | #100 | Exceptional $109,668 |
| Immigrants | Ukraine | 97.2 /100 | #101 | Exceptional $109,645 |
| Assyrians/Chaldeans/Syriacs | 97.2 /100 | #102 | Exceptional $109,622 |
| Immigrants | Brazil | 96.9 /100 | #103 | Exceptional $109,418 |
| Palestinians | 96.9 /100 | #104 | Exceptional $109,413 |
| Syrians | 96.7 /100 | #105 | Exceptional $109,299 |
| Albanians | 96.4 /100 | #106 | Exceptional $109,136 |
| Immigrants | North Macedonia | 96.4 /100 | #107 | Exceptional $109,136 |
| Immigrants | Zimbabwe | 95.9 /100 | #108 | Exceptional $108,830 |
| Immigrants | Afghanistan | 95.6 /100 | #109 | Exceptional $108,709 |
| British | 95.6 /100 | #110 | Exceptional $108,705 |
| Immigrants | Western Asia | 95.6 /100 | #111 | Exceptional $108,691 |
| Immigrants | Poland | 95.3 /100 | #112 | Exceptional $108,570 |
| Immigrants | Saudi Arabia | 95.2 /100 | #113 | Exceptional $108,544 |
| Poles | 95.2 /100 | #114 | Exceptional $108,507 |