Ecuadorian vs South African Median Family Income
COMPARE
Ecuadorian
South African
Median Family Income
Median Family Income Comparison
Ecuadorians
South Africans
$95,114
MEDIAN FAMILY INCOME
2.1/ 100
METRIC RATING
231st/ 347
METRIC RANK
$113,229
MEDIAN FAMILY INCOME
99.5/ 100
METRIC RATING
71st/ 347
METRIC RANK
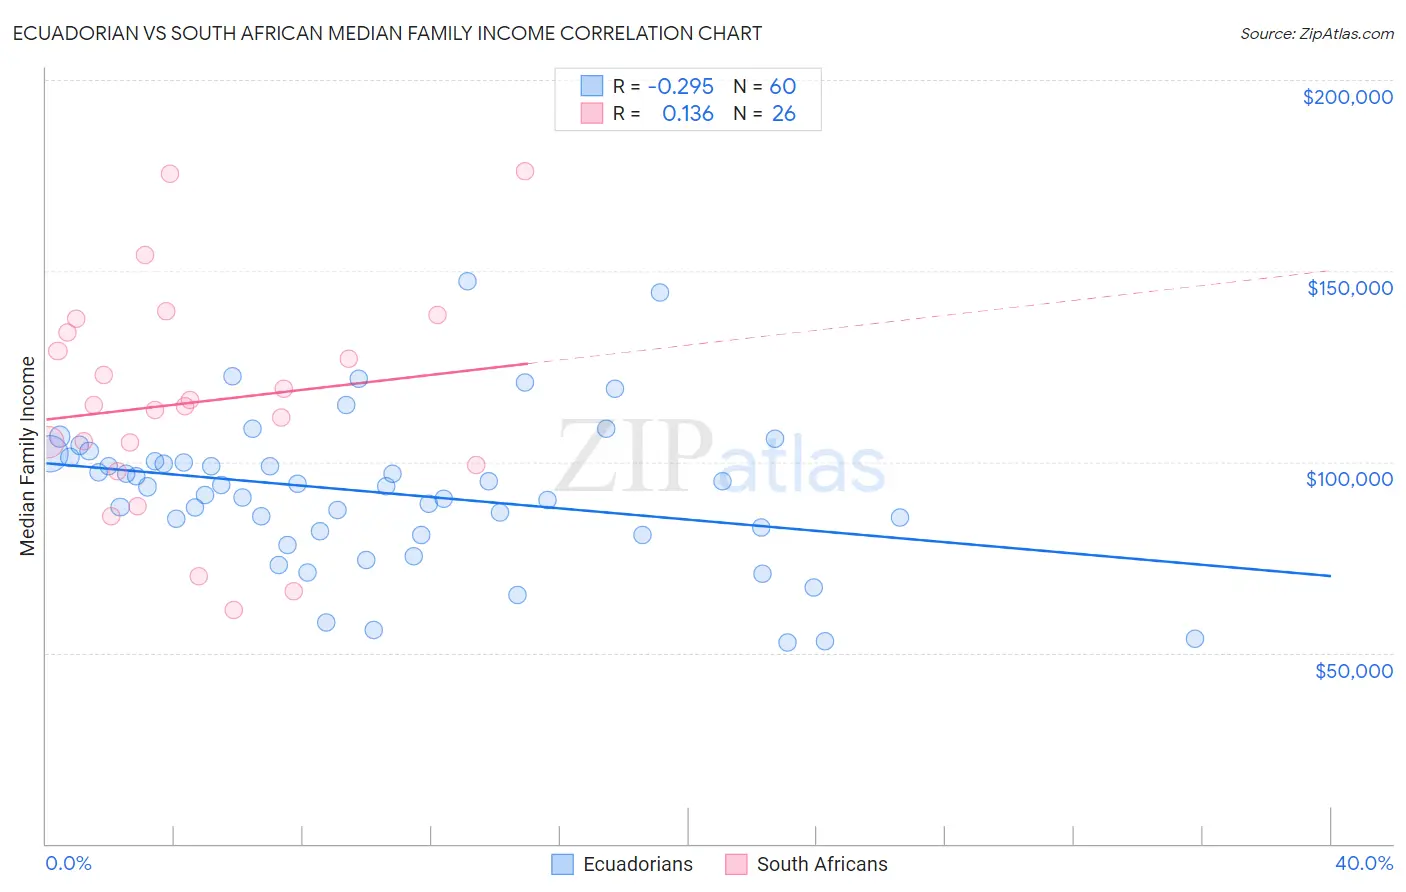
Ecuadorian vs South African Median Family Income Correlation Chart
The statistical analysis conducted on geographies consisting of 317,539,775 people shows a weak negative correlation between the proportion of Ecuadorians and median family income in the United States with a correlation coefficient (R) of -0.295 and weighted average of $95,114. Similarly, the statistical analysis conducted on geographies consisting of 182,514,560 people shows a poor positive correlation between the proportion of South Africans and median family income in the United States with a correlation coefficient (R) of 0.136 and weighted average of $113,229, a difference of 19.1%.
Median Family Income Correlation Summary
| Measurement | Ecuadorian | South African |
| Minimum | $52,846 | $61,250 |
| Maximum | $147,371 | $176,195 |
| Range | $94,525 | $114,945 |
| Mean | $91,870 | $115,662 |
| Median | $93,530 | $114,722 |
| Interquartile 25% (IQ1) | $81,441 | $99,219 |
| Interquartile 75% (IQ3) | $100,588 | $133,864 |
| Interquartile Range (IQR) | $19,147 | $34,645 |
| Standard Deviation (Sample) | $19,583 | $29,017 |
| Standard Deviation (Population) | $19,420 | $28,454 |
Similar Demographics by Median Family Income
Demographics Similar to Ecuadorians by Median Family Income
In terms of median family income, the demographic groups most similar to Ecuadorians are Malaysian ($95,230, a difference of 0.12%), Marshallese ($95,293, a difference of 0.19%), Immigrants from Venezuela ($94,904, a difference of 0.22%), Immigrants from the Azores ($95,402, a difference of 0.30%), and Immigrants from Bangladesh ($94,665, a difference of 0.47%).
| Demographics | Rating | Rank | Median Family Income |
| Immigrants | Nonimmigrants | 3.6 /100 | #224 | Tragic $96,231 |
| Vietnamese | 3.4 /100 | #225 | Tragic $96,123 |
| Immigrants | Panama | 2.7 /100 | #226 | Tragic $95,647 |
| Alaska Natives | 2.6 /100 | #227 | Tragic $95,573 |
| Immigrants | Azores | 2.4 /100 | #228 | Tragic $95,402 |
| Marshallese | 2.2 /100 | #229 | Tragic $95,293 |
| Malaysians | 2.2 /100 | #230 | Tragic $95,230 |
| Ecuadorians | 2.1 /100 | #231 | Tragic $95,114 |
| Immigrants | Venezuela | 1.9 /100 | #232 | Tragic $94,904 |
| Immigrants | Bangladesh | 1.6 /100 | #233 | Tragic $94,665 |
| Immigrants | Western Africa | 1.6 /100 | #234 | Tragic $94,638 |
| Immigrants | Burma/Myanmar | 1.5 /100 | #235 | Tragic $94,472 |
| Trinidadians and Tobagonians | 1.5 /100 | #236 | Tragic $94,466 |
| Alaskan Athabascans | 1.5 /100 | #237 | Tragic $94,429 |
| Nepalese | 1.3 /100 | #238 | Tragic $94,153 |
Demographics Similar to South Africans by Median Family Income
In terms of median family income, the demographic groups most similar to South Africans are Immigrants from Romania ($113,434, a difference of 0.18%), Immigrants from Bulgaria ($113,461, a difference of 0.20%), Immigrants from Serbia ($113,463, a difference of 0.21%), Afghan ($112,971, a difference of 0.23%), and Laotian ($112,859, a difference of 0.33%).
| Demographics | Rating | Rank | Median Family Income |
| Immigrants | Scotland | 99.7 /100 | #64 | Exceptional $114,392 |
| Egyptians | 99.7 /100 | #65 | Exceptional $114,119 |
| Paraguayans | 99.7 /100 | #66 | Exceptional $114,016 |
| Immigrants | Spain | 99.7 /100 | #67 | Exceptional $113,815 |
| Immigrants | Serbia | 99.6 /100 | #68 | Exceptional $113,463 |
| Immigrants | Bulgaria | 99.6 /100 | #69 | Exceptional $113,461 |
| Immigrants | Romania | 99.6 /100 | #70 | Exceptional $113,434 |
| South Africans | 99.5 /100 | #71 | Exceptional $113,229 |
| Afghans | 99.5 /100 | #72 | Exceptional $112,971 |
| Laotians | 99.5 /100 | #73 | Exceptional $112,859 |
| Immigrants | Italy | 99.4 /100 | #74 | Exceptional $112,848 |
| Immigrants | Western Europe | 99.4 /100 | #75 | Exceptional $112,688 |
| Argentineans | 99.4 /100 | #76 | Exceptional $112,665 |
| Immigrants | Eastern Europe | 99.4 /100 | #77 | Exceptional $112,527 |
| Immigrants | Canada | 99.3 /100 | #78 | Exceptional $112,374 |