French Canadian vs Immigrants from North Macedonia Median Family Income
COMPARE
French Canadian
Immigrants from North Macedonia
Median Family Income
Median Family Income Comparison
French Canadians
Immigrants from North Macedonia
$101,634
MEDIAN FAMILY INCOME
37.0/ 100
METRIC RATING
180th/ 347
METRIC RANK
$109,136
MEDIAN FAMILY INCOME
96.4/ 100
METRIC RATING
107th/ 347
METRIC RANK
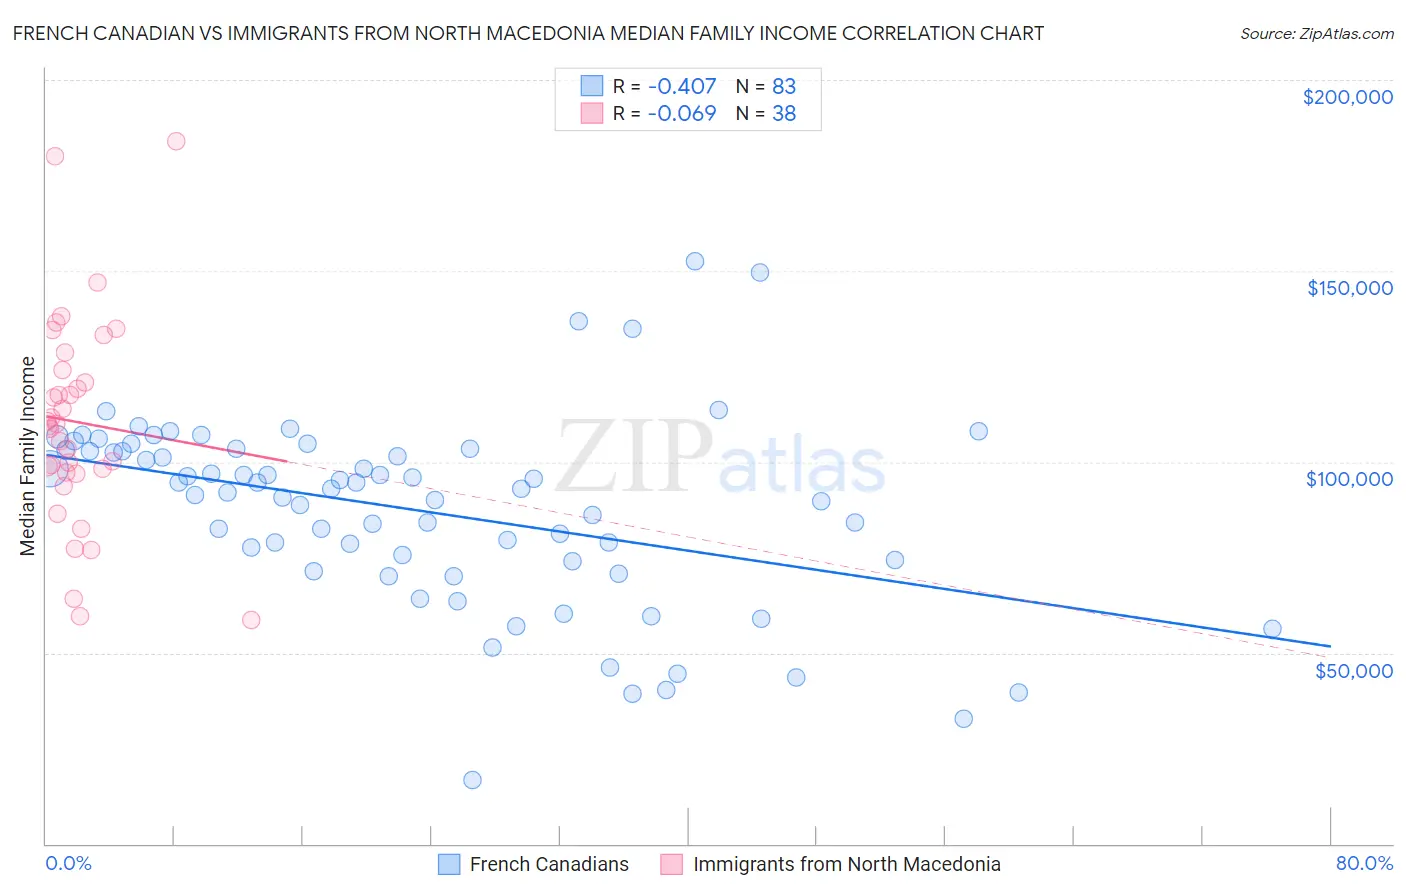
French Canadian vs Immigrants from North Macedonia Median Family Income Correlation Chart
The statistical analysis conducted on geographies consisting of 501,962,577 people shows a moderate negative correlation between the proportion of French Canadians and median family income in the United States with a correlation coefficient (R) of -0.407 and weighted average of $101,634. Similarly, the statistical analysis conducted on geographies consisting of 74,300,796 people shows a slight negative correlation between the proportion of Immigrants from North Macedonia and median family income in the United States with a correlation coefficient (R) of -0.069 and weighted average of $109,136, a difference of 7.4%.
Median Family Income Correlation Summary
| Measurement | French Canadian | Immigrants from North Macedonia |
| Minimum | $16,696 | $58,625 |
| Maximum | $152,574 | $184,091 |
| Range | $135,878 | $125,466 |
| Mean | $87,243 | $110,416 |
| Median | $92,910 | $109,646 |
| Interquartile 25% (IQ1) | $74,042 | $97,322 |
| Interquartile 75% (IQ3) | $103,222 | $124,196 |
| Interquartile Range (IQR) | $29,180 | $26,874 |
| Standard Deviation (Sample) | $24,938 | $27,502 |
| Standard Deviation (Population) | $24,788 | $27,137 |
Similar Demographics by Median Family Income
Demographics Similar to French Canadians by Median Family Income
In terms of median family income, the demographic groups most similar to French Canadians are Spaniard ($101,617, a difference of 0.020%), Tsimshian ($101,543, a difference of 0.090%), Kenyan ($101,417, a difference of 0.21%), South American ($101,856, a difference of 0.22%), and Immigrants from Costa Rica ($101,354, a difference of 0.28%).
| Demographics | Rating | Rank | Median Family Income |
| Belgians | 51.4 /100 | #173 | Average $102,788 |
| Finns | 50.0 /100 | #174 | Average $102,676 |
| Immigrants | Eastern Africa | 47.1 /100 | #175 | Average $102,451 |
| French | 46.1 /100 | #176 | Average $102,368 |
| Germans | 44.6 /100 | #177 | Average $102,254 |
| Welsh | 43.3 /100 | #178 | Average $102,151 |
| South Americans | 39.7 /100 | #179 | Fair $101,856 |
| French Canadians | 37.0 /100 | #180 | Fair $101,634 |
| Spaniards | 36.8 /100 | #181 | Fair $101,617 |
| Tsimshian | 35.9 /100 | #182 | Fair $101,543 |
| Kenyans | 34.5 /100 | #183 | Fair $101,417 |
| Immigrants | Costa Rica | 33.7 /100 | #184 | Fair $101,354 |
| Dutch | 31.9 /100 | #185 | Fair $101,192 |
| Celtics | 31.3 /100 | #186 | Fair $101,139 |
| Tlingit-Haida | 30.8 /100 | #187 | Fair $101,092 |
Demographics Similar to Immigrants from North Macedonia by Median Family Income
In terms of median family income, the demographic groups most similar to Immigrants from North Macedonia are Albanian ($109,136, a difference of 0.0%), Syrian ($109,299, a difference of 0.15%), Palestinian ($109,413, a difference of 0.25%), Immigrants from Brazil ($109,418, a difference of 0.26%), and Immigrants from Zimbabwe ($108,830, a difference of 0.28%).
| Demographics | Rating | Rank | Median Family Income |
| Macedonians | 97.3 /100 | #100 | Exceptional $109,668 |
| Immigrants | Ukraine | 97.2 /100 | #101 | Exceptional $109,645 |
| Assyrians/Chaldeans/Syriacs | 97.2 /100 | #102 | Exceptional $109,622 |
| Immigrants | Brazil | 96.9 /100 | #103 | Exceptional $109,418 |
| Palestinians | 96.9 /100 | #104 | Exceptional $109,413 |
| Syrians | 96.7 /100 | #105 | Exceptional $109,299 |
| Albanians | 96.4 /100 | #106 | Exceptional $109,136 |
| Immigrants | North Macedonia | 96.4 /100 | #107 | Exceptional $109,136 |
| Immigrants | Zimbabwe | 95.9 /100 | #108 | Exceptional $108,830 |
| Immigrants | Afghanistan | 95.6 /100 | #109 | Exceptional $108,709 |
| British | 95.6 /100 | #110 | Exceptional $108,705 |
| Immigrants | Western Asia | 95.6 /100 | #111 | Exceptional $108,691 |
| Immigrants | Poland | 95.3 /100 | #112 | Exceptional $108,570 |
| Immigrants | Saudi Arabia | 95.2 /100 | #113 | Exceptional $108,544 |
| Poles | 95.2 /100 | #114 | Exceptional $108,507 |