Ecuadorian vs Indian (Asian) Median Family Income

COMPARE

Ecuadorian
Race
Ancestry
AfghanAfricanAlaska NativeAlaskan AthabascanAlbanianAleutAlsatianAmericanApacheArabArapahoArgentineanArmenianAssyrian/Chaldean/SyriacAustralianAustrianBahamianBangladeshiBarbadianBasqueBelgianBelizeanBermudanBhutaneseBlackfeetBolivianBrazilianBritishBritish West IndianBulgarianBurmeseCajunCambodianCanadianCape VerdeanCarpatho RusynCelticCentral AmericanCentral American IndianCherokeeCheyenneChickasawChileanChineseChippewaChoctawColombianColvilleComancheCosta RicanCreeCreekCroatianCrowCubanCypriotCzechCzechoslovakianDanishDelawareDominicanDutchDutch West IndianEastern EuropeanEcuadorianEgyptianEnglishEstonianEthiopianEuropeanFijianFilipinoFinnishFrenchFrench American IndianFrench CanadianGermanGerman RussianGhanaianGreekGuamanian/ChamorroGuatemalanGuyaneseHaitianHmongHonduranHopiHoumaHungarianIcelanderIndonesianInupiatIranianIraqiIrishIroquoisIsraeliItalianJamaicanJapaneseJordanianKenyanKiowaKoreanLaotianLatvianLebaneseLiberianLithuanianLumbeeLuxembourgerMacedonianMalaysianMalteseMarshalleseMenomineeMexicanMexican American IndianMongolianMoroccanNative HawaiianNavajoNepaleseNew ZealanderNicaraguanNigerianNorthern EuropeanNorwegianOkinawanOsageOttawaPaiutePakistaniPalestinianPanamanianParaguayanPennsylvania GermanPeruvianPimaPolishPortuguesePotawatomiPuebloPuerto RicanPuget Sound SalishRomanianRussianSalvadoranSamoanScandinavianScotch-IrishScottishSeminoleSenegaleseSerbianShoshoneSierra LeoneanSiouxSlavicSlovakSloveneSomaliSouth AfricanSouth AmericanSouth American IndianSoviet UnionSpaniardSpanishSpanish AmericanSpanish American IndianSri LankanSubsaharan AfricanSudaneseSwedishSwissSyrianTaiwaneseThaiTlingit-HaidaTohono O'OdhamTonganTrinidadian and TobagonianTsimshianTurkishU.S. Virgin IslanderUgandanUkrainianUruguayanUteVenezuelanVietnameseWelshWest IndianYakamaYaquiYugoslavianYumanYup'ikZimbabwean
Immigration
NonimmigrantsImmigrantsAfghanistanAfricaAlbaniaArgentinaArmeniaAsiaAustraliaAustriaBahamasBangladeshBarbadosBelarusBelgiumBelizeBoliviaBosnia and HerzegovinaBrazilBulgariaBurma/MyanmarCabo VerdeCambodiaCameroonCanadaCaribbeanCentral AmericaChileChinaColombiaCongoCosta RicaCroatiaCubaCzechoslovakiaDenmarkDominicaDominican RepublicEastern AfricaEastern AsiaEastern EuropeEcuadorEgyptEl SalvadorEnglandEritreaEthiopiaEuropeFijiFranceGermanyGhanaGreeceGrenadaGuatemalaGuyanaHaitiHondurasHong KongHungaryIndiaIndonesiaIranIraqIrelandIsraelItalyJamaicaJapanJordanKazakhstanKenyaKoreaKuwaitLaosLatin AmericaLatviaLebanonLiberiaLithuaniaMalaysiaMexicoMicronesiaMiddle AfricaMoldovaMoroccoNepalNetherlandsNicaraguaNigeriaNorth AmericaNorth MacedoniaNorthern AfricaNorthern EuropeNorwayOceaniaPakistanPanamaPeruPhilippinesPolandPortugalRomaniaRussiaSaudi ArabiaScotlandSenegalSerbiaSierra LeoneSingaporeSomaliaSouth AfricaSouth AmericaSouth Central AsiaSouth Eastern AsiaSouthern EuropeSpainSri LankaSt. Vincent and the GrenadinesSudanSwedenSwitzerlandSyriaTaiwanThailandTrinidad and TobagoTurkeyUgandaUkraineUruguayUzbekistanVenezuelaVietnamWest IndiesWestern AfricaWestern AsiaWestern EuropeYemenZaireZimbabweAzores
Indian (Asian)
Race
Ancestry
AfghanAfricanAlaska NativeAlaskan AthabascanAlbanianAleutAlsatianAmericanApacheArabArapahoArgentineanArmenianAssyrian/Chaldean/SyriacAustralianAustrianBahamianBangladeshiBarbadianBasqueBelgianBelizeanBermudanBhutaneseBlackfeetBolivianBrazilianBritishBritish West IndianBulgarianBurmeseCajunCambodianCanadianCape VerdeanCarpatho RusynCelticCentral AmericanCentral American IndianCherokeeCheyenneChickasawChileanChineseChippewaChoctawColombianColvilleComancheCosta RicanCreeCreekCroatianCrowCubanCypriotCzechCzechoslovakianDanishDelawareDominicanDutchDutch West IndianEastern EuropeanEgyptianEnglishEstonianEthiopianEuropeanFijianFilipinoFinnishFrenchFrench American IndianFrench CanadianGermanGerman RussianGhanaianGreekGuamanian/ChamorroGuatemalanGuyaneseHaitianHmongHonduranHopiHoumaHungarianIcelanderIndian (Asian)IndonesianInupiatIranianIraqiIrishIroquoisIsraeliItalianJamaicanJapaneseJordanianKenyanKiowaKoreanLaotianLatvianLebaneseLiberianLithuanianLumbeeLuxembourgerMacedonianMalaysianMalteseMarshalleseMenomineeMexicanMexican American IndianMongolianMoroccanNative HawaiianNavajoNepaleseNew ZealanderNicaraguanNigerianNorthern EuropeanNorwegianOkinawanOsageOttawaPaiutePakistaniPalestinianPanamanianParaguayanPennsylvania GermanPeruvianPimaPolishPortuguesePotawatomiPuebloPuerto RicanPuget Sound SalishRomanianRussianSalvadoranSamoanScandinavianScotch-IrishScottishSeminoleSenegaleseSerbianShoshoneSierra LeoneanSiouxSlavicSlovakSloveneSomaliSouth AfricanSouth AmericanSouth American IndianSoviet UnionSpaniardSpanishSpanish AmericanSpanish American IndianSri LankanSubsaharan AfricanSudaneseSwedishSwissSyrianTaiwaneseThaiTlingit-HaidaTohono O'OdhamTonganTrinidadian and TobagonianTsimshianTurkishU.S. Virgin IslanderUgandanUkrainianUruguayanUteVenezuelanVietnameseWelshWest IndianYakamaYaquiYugoslavianYumanYup'ikZimbabwean
Immigration
NonimmigrantsImmigrantsAfghanistanAfricaAlbaniaArgentinaArmeniaAsiaAustraliaAustriaBahamasBangladeshBarbadosBelarusBelgiumBelizeBoliviaBosnia and HerzegovinaBrazilBulgariaBurma/MyanmarCabo VerdeCambodiaCameroonCanadaCaribbeanCentral AmericaChileChinaColombiaCongoCosta RicaCroatiaCubaCzechoslovakiaDenmarkDominicaDominican RepublicEastern AfricaEastern AsiaEastern EuropeEcuadorEgyptEl SalvadorEnglandEritreaEthiopiaEuropeFijiFranceGermanyGhanaGreeceGrenadaGuatemalaGuyanaHaitiHondurasHong KongHungaryIndiaIndonesiaIranIraqIrelandIsraelItalyJamaicaJapanJordanKazakhstanKenyaKoreaKuwaitLaosLatin AmericaLatviaLebanonLiberiaLithuaniaMalaysiaMexicoMicronesiaMiddle AfricaMoldovaMoroccoNepalNetherlandsNicaraguaNigeriaNorth AmericaNorth MacedoniaNorthern AfricaNorthern EuropeNorwayOceaniaPakistanPanamaPeruPhilippinesPolandPortugalRomaniaRussiaSaudi ArabiaScotlandSenegalSerbiaSierra LeoneSingaporeSomaliaSouth AfricaSouth AmericaSouth Central AsiaSouth Eastern AsiaSouthern EuropeSpainSri LankaSt. Vincent and the GrenadinesSudanSwedenSwitzerlandSyriaTaiwanThailandTrinidad and TobagoTurkeyUgandaUkraineUruguayUzbekistanVenezuelaVietnamWest IndiesWestern AfricaWestern AsiaWestern EuropeYemenZaireZimbabweAzores
Median Family Income
Income
Poverty
Unemployment
Labor Participation
Family Structure
Vehicle Availability
Education Level
Disability

Median Family Income Comparison

Ecuadorians

Indians (Asian)

Tragic
Exceptional
$95,114
MEDIAN FAMILY INCOME
2.1/ 100
METRIC RATING
231st/ 347
METRIC RANK
$125,312
MEDIAN FAMILY INCOME
100.0/ 100
METRIC RATING
17th/ 347
METRIC RANK

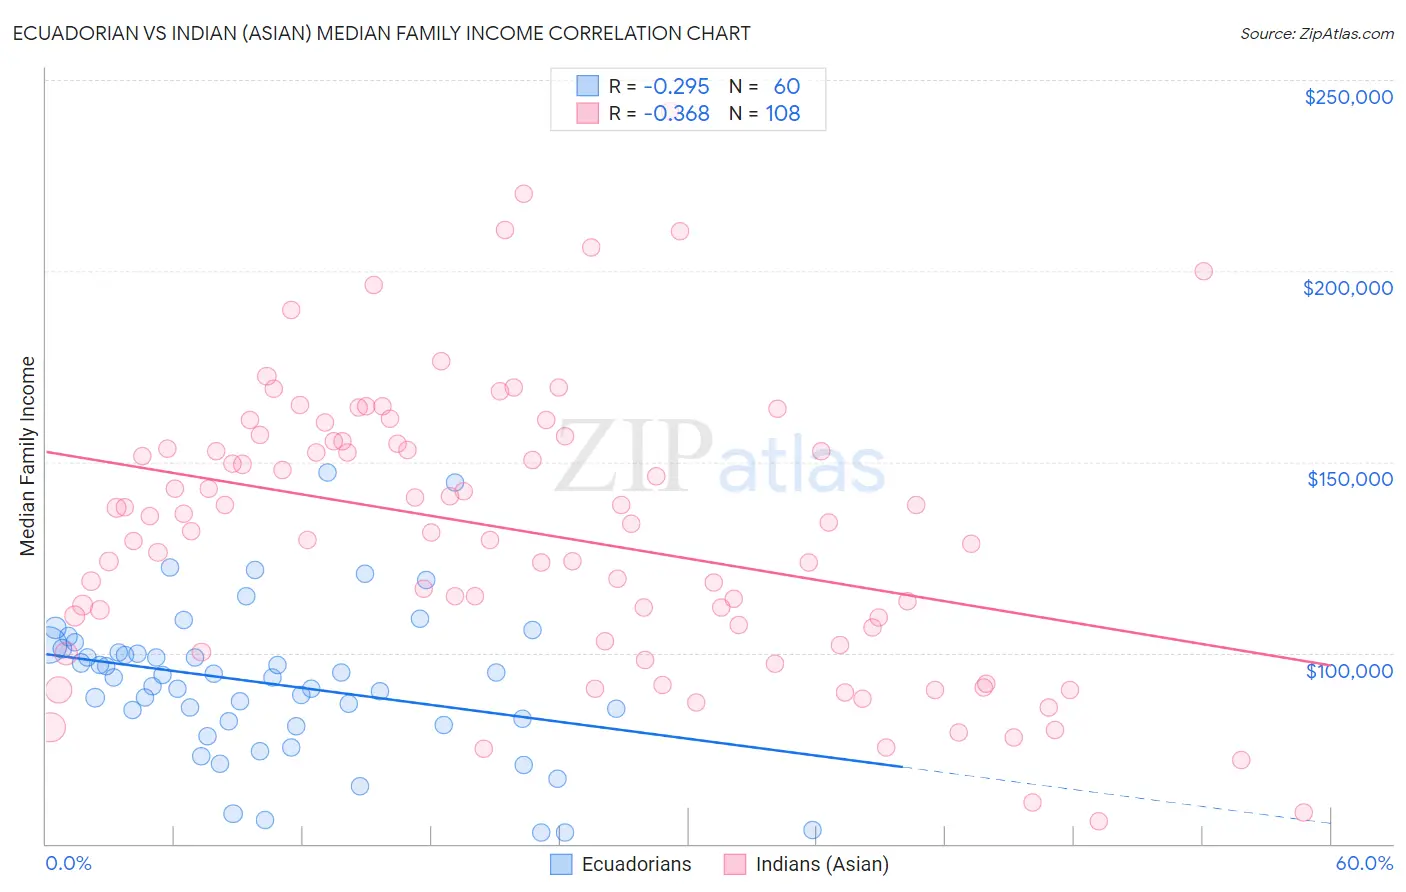
Ecuadorian vs Indian (Asian) Median Family Income Correlation Chart

The statistical analysis conducted on geographies consisting of 317,539,775 people shows a weak negative correlation between the proportion of Ecuadorians and median family income in the United States with a correlation coefficient (R) of -0.295 and weighted average of $95,114. Similarly, the statistical analysis conducted on geographies consisting of 494,431,104 people shows a mild negative correlation between the proportion of Indians (Asian) and median family income in the United States with a correlation coefficient (R) of -0.368 and weighted average of $125,312, a difference of 31.8%.
Ecuadorian vs Indian (Asian) Median Family Income

Median Family Income Correlation Summary

MeasurementEcuadorianIndian (Asian)
Minimum$52,846$56,023
Maximum$147,371$241,763
Range$94,525$185,740
Mean$91,870$131,617
Median$93,530$132,818
Interquartile 25% (IQ1)$81,441$104,858
Interquartile 75% (IQ3)$100,588$155,124
Interquartile Range (IQR)$19,147$50,266
Standard Deviation (Sample)$19,583$36,827
Standard Deviation (Population)$19,420$36,656

Similar Demographics by Median Family Income

Demographics Similar to Ecuadorians by Median Family Income

In terms of median family income, the demographic groups most similar to Ecuadorians are Malaysian ($95,230, a difference of 0.12%), Marshallese ($95,293, a difference of 0.19%), Immigrants from Venezuela ($94,904, a difference of 0.22%), Immigrants from the Azores ($95,402, a difference of 0.30%), and Immigrants from Bangladesh ($94,665, a difference of 0.47%).
DemographicsRating | RankMedian Family Income
Immigrants | Nonimmigrants
3.6
/100
|
#224
Tragic
$96,231
Vietnamese
3.4
/100
|
#225
Tragic
$96,123
Immigrants | Panama
2.7
/100
|
#226
Tragic
$95,647
Alaska Natives
2.6
/100
|
#227
Tragic
$95,573
Immigrants | Azores
2.4
/100
|
#228
Tragic
$95,402
Marshallese
2.2
/100
|
#229
Tragic
$95,293
Malaysians
2.2
/100
|
#230
Tragic
$95,230
Ecuadorians
2.1
/100
|
#231
Tragic
$95,114
Immigrants | Venezuela
1.9
/100
|
#232
Tragic
$94,904
Immigrants | Bangladesh
1.6
/100
|
#233
Tragic
$94,665
Immigrants | Western Africa
1.6
/100
|
#234
Tragic
$94,638
Immigrants | Burma/Myanmar
1.5
/100
|
#235
Tragic
$94,472
Trinidadians and Tobagonians
1.5
/100
|
#236
Tragic
$94,466
Alaskan Athabascans
1.5
/100
|
#237
Tragic
$94,429
Nepalese
1.3
/100
|
#238
Tragic
$94,153

Demographics Similar to Indians (Asian) by Median Family Income

In terms of median family income, the demographic groups most similar to Indians (Asian) are Immigrants from Eastern Asia ($125,150, a difference of 0.13%), Immigrants from China ($125,540, a difference of 0.18%), Eastern European ($125,546, a difference of 0.19%), Immigrants from South Central Asia ($125,956, a difference of 0.51%), and Immigrants from Australia ($126,620, a difference of 1.0%).
DemographicsRating | RankMedian Family Income
Immigrants | Ireland
100.0
/100
|
#10
Exceptional
$127,584
Immigrants | Israel
100.0
/100
|
#11
Exceptional
$127,430
Cypriots
100.0
/100
|
#12
Exceptional
$127,064
Immigrants | Australia
100.0
/100
|
#13
Exceptional
$126,620
Immigrants | South Central Asia
100.0
/100
|
#14
Exceptional
$125,956
Eastern Europeans
100.0
/100
|
#15
Exceptional
$125,546
Immigrants | China
100.0
/100
|
#16
Exceptional
$125,540
Indians (Asian)
100.0
/100
|
#17
Exceptional
$125,312
Immigrants | Eastern Asia
100.0
/100
|
#18
Exceptional
$125,150
Immigrants | Belgium
100.0
/100
|
#19
Exceptional
$123,831
Burmese
100.0
/100
|
#20
Exceptional
$123,369
Immigrants | Korea
100.0
/100
|
#21
Exceptional
$122,800
Immigrants | Sweden
100.0
/100
|
#22
Exceptional
$122,765
Immigrants | Japan
100.0
/100
|
#23
Exceptional
$122,764
Immigrants | Northern Europe
100.0
/100
|
#24
Exceptional
$121,840