British vs Immigrants from North Macedonia Median Family Income
COMPARE
British
Immigrants from North Macedonia
Median Family Income
Median Family Income Comparison
British
Immigrants from North Macedonia
$108,705
MEDIAN FAMILY INCOME
95.6/ 100
METRIC RATING
110th/ 347
METRIC RANK
$109,136
MEDIAN FAMILY INCOME
96.4/ 100
METRIC RATING
107th/ 347
METRIC RANK
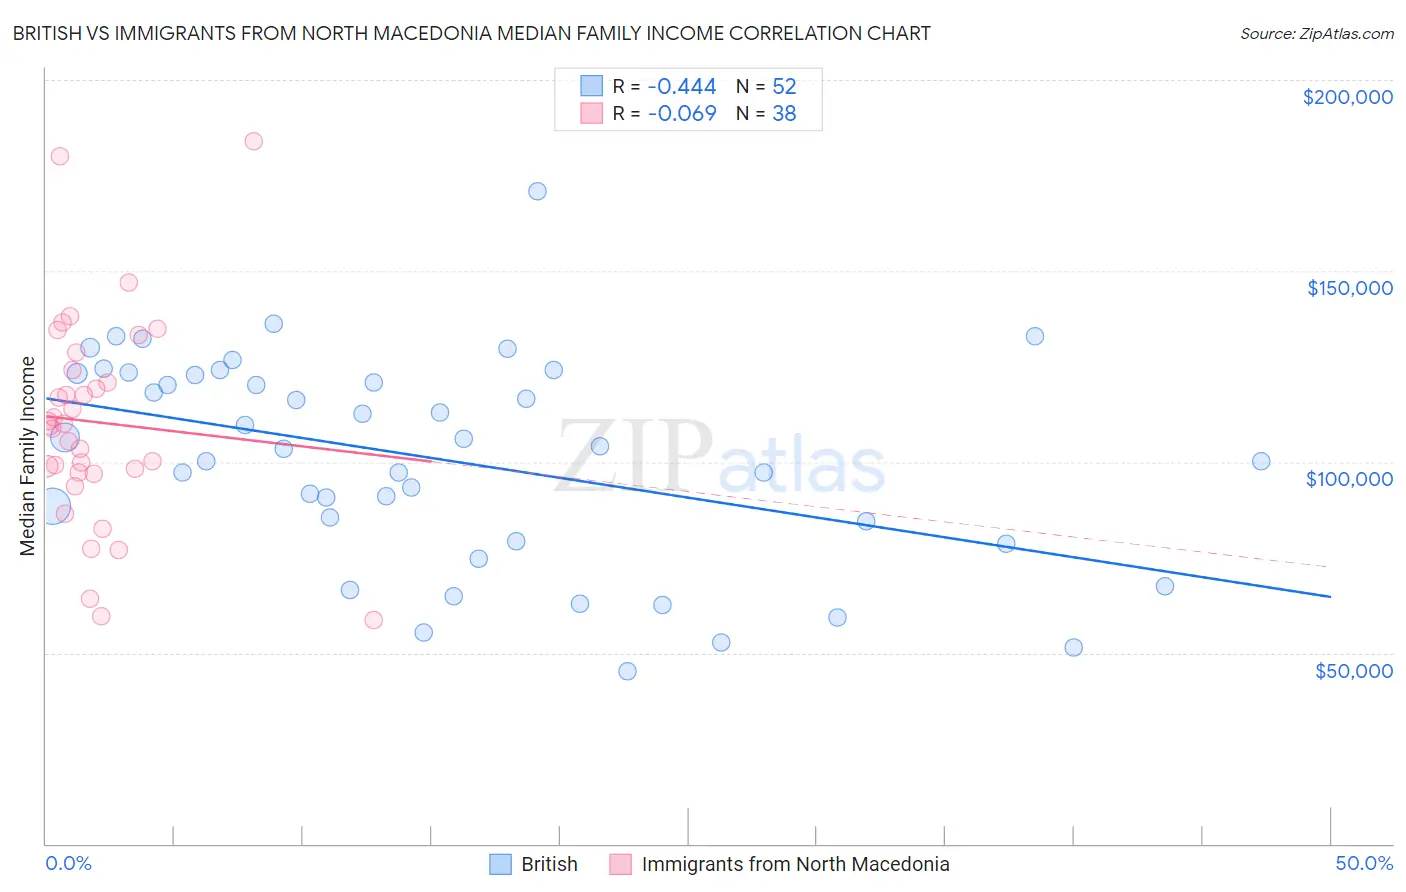
British vs Immigrants from North Macedonia Median Family Income Correlation Chart
The statistical analysis conducted on geographies consisting of 530,672,110 people shows a moderate negative correlation between the proportion of British and median family income in the United States with a correlation coefficient (R) of -0.444 and weighted average of $108,705. Similarly, the statistical analysis conducted on geographies consisting of 74,300,796 people shows a slight negative correlation between the proportion of Immigrants from North Macedonia and median family income in the United States with a correlation coefficient (R) of -0.069 and weighted average of $109,136, a difference of 0.40%.
Median Family Income Correlation Summary
| Measurement | British | Immigrants from North Macedonia |
| Minimum | $45,060 | $58,625 |
| Maximum | $170,856 | $184,091 |
| Range | $125,796 | $125,466 |
| Mean | $100,714 | $110,416 |
| Median | $103,902 | $109,646 |
| Interquartile 25% (IQ1) | $81,768 | $97,322 |
| Interquartile 75% (IQ3) | $123,002 | $124,196 |
| Interquartile Range (IQR) | $41,234 | $26,874 |
| Standard Deviation (Sample) | $27,270 | $27,502 |
| Standard Deviation (Population) | $27,007 | $27,137 |
Demographics Similar to British and Immigrants from North Macedonia by Median Family Income
In terms of median family income, the demographic groups most similar to British are Immigrants from Afghanistan ($108,709, a difference of 0.0%), Immigrants from Western Asia ($108,691, a difference of 0.010%), Immigrants from Zimbabwe ($108,830, a difference of 0.12%), Immigrants from Poland ($108,570, a difference of 0.12%), and Immigrants from Saudi Arabia ($108,544, a difference of 0.15%). Similarly, the demographic groups most similar to Immigrants from North Macedonia are Albanian ($109,136, a difference of 0.0%), Syrian ($109,299, a difference of 0.15%), Palestinian ($109,413, a difference of 0.25%), Immigrants from Brazil ($109,418, a difference of 0.26%), and Immigrants from Zimbabwe ($108,830, a difference of 0.28%).
| Demographics | Rating | Rank | Median Family Income |
| Immigrants | Kuwait | 97.4 /100 | #98 | Exceptional $109,731 |
| Armenians | 97.3 /100 | #99 | Exceptional $109,692 |
| Macedonians | 97.3 /100 | #100 | Exceptional $109,668 |
| Immigrants | Ukraine | 97.2 /100 | #101 | Exceptional $109,645 |
| Assyrians/Chaldeans/Syriacs | 97.2 /100 | #102 | Exceptional $109,622 |
| Immigrants | Brazil | 96.9 /100 | #103 | Exceptional $109,418 |
| Palestinians | 96.9 /100 | #104 | Exceptional $109,413 |
| Syrians | 96.7 /100 | #105 | Exceptional $109,299 |
| Albanians | 96.4 /100 | #106 | Exceptional $109,136 |
| Immigrants | North Macedonia | 96.4 /100 | #107 | Exceptional $109,136 |
| Immigrants | Zimbabwe | 95.9 /100 | #108 | Exceptional $108,830 |
| Immigrants | Afghanistan | 95.6 /100 | #109 | Exceptional $108,709 |
| British | 95.6 /100 | #110 | Exceptional $108,705 |
| Immigrants | Western Asia | 95.6 /100 | #111 | Exceptional $108,691 |
| Immigrants | Poland | 95.3 /100 | #112 | Exceptional $108,570 |
| Immigrants | Saudi Arabia | 95.2 /100 | #113 | Exceptional $108,544 |
| Poles | 95.2 /100 | #114 | Exceptional $108,507 |
| Swedes | 95.1 /100 | #115 | Exceptional $108,499 |
| Chileans | 95.0 /100 | #116 | Exceptional $108,429 |
| Immigrants | Philippines | 94.6 /100 | #117 | Exceptional $108,288 |
| Ethiopians | 94.5 /100 | #118 | Exceptional $108,251 |