Ecuadorian vs Immigrants from North Macedonia Professional Degree
COMPARE
Ecuadorian
Immigrants from North Macedonia
Professional Degree
Professional Degree Comparison
Ecuadorians
Immigrants from North Macedonia
3.9%
PROFESSIONAL DEGREE
4.6/ 100
METRIC RATING
231st/ 347
METRIC RANK
4.2%
PROFESSIONAL DEGREE
20.2/ 100
METRIC RATING
200th/ 347
METRIC RANK
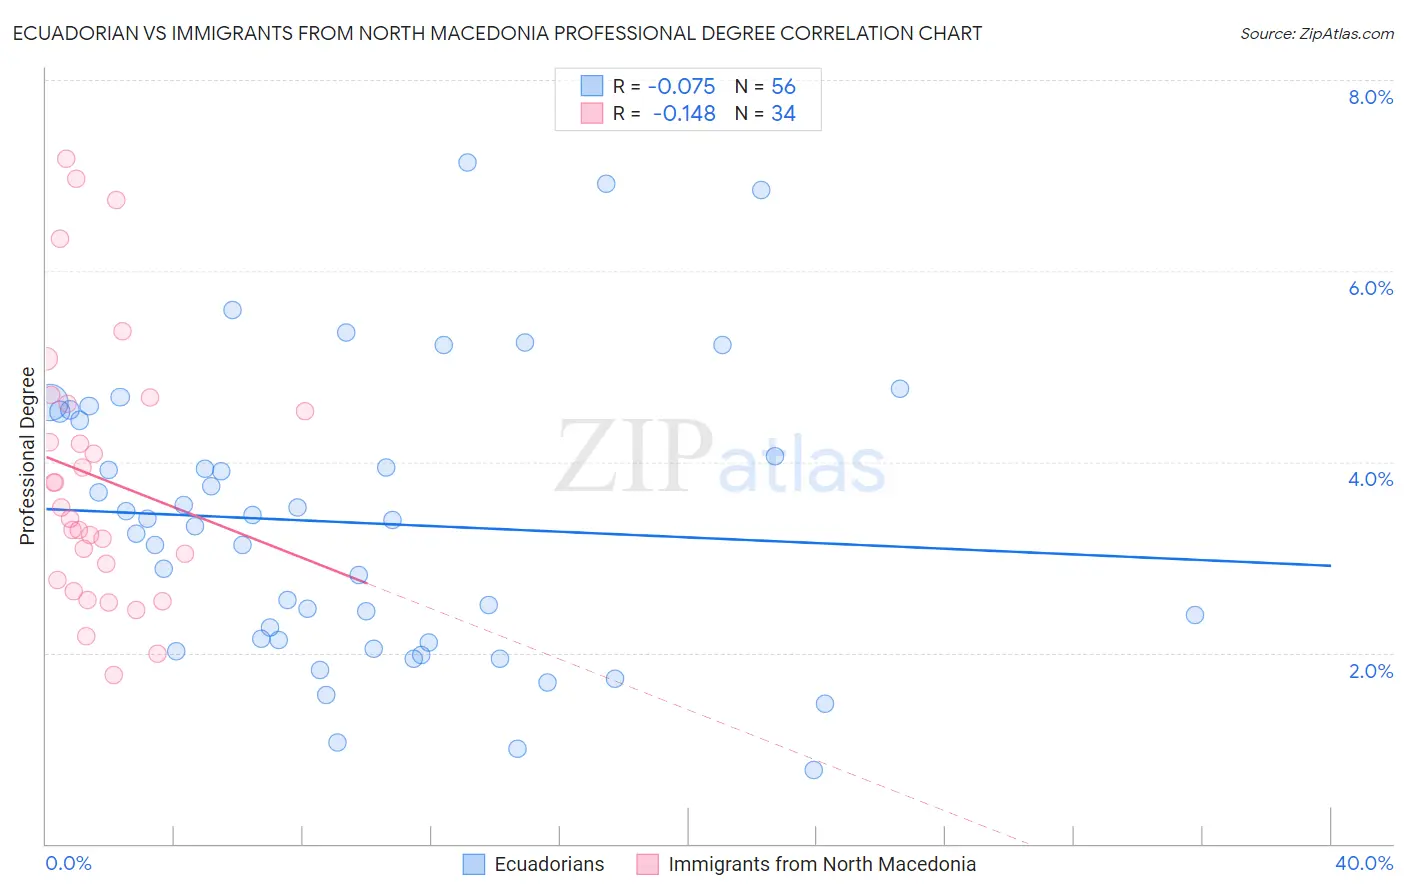
Ecuadorian vs Immigrants from North Macedonia Professional Degree Correlation Chart
The statistical analysis conducted on geographies consisting of 317,407,214 people shows a slight negative correlation between the proportion of Ecuadorians and percentage of population with at least professional degree education in the United States with a correlation coefficient (R) of -0.075 and weighted average of 3.9%. Similarly, the statistical analysis conducted on geographies consisting of 74,021,908 people shows a poor negative correlation between the proportion of Immigrants from North Macedonia and percentage of population with at least professional degree education in the United States with a correlation coefficient (R) of -0.148 and weighted average of 4.2%, a difference of 6.8%.
Professional Degree Correlation Summary
| Measurement | Ecuadorian | Immigrants from North Macedonia |
| Minimum | 0.77% | 1.8% |
| Maximum | 7.1% | 7.2% |
| Range | 6.4% | 5.4% |
| Mean | 3.4% | 3.8% |
| Median | 3.4% | 3.5% |
| Interquartile 25% (IQ1) | 2.1% | 2.8% |
| Interquartile 75% (IQ3) | 4.5% | 4.6% |
| Interquartile Range (IQR) | 2.4% | 1.8% |
| Standard Deviation (Sample) | 1.5% | 1.4% |
| Standard Deviation (Population) | 1.5% | 1.4% |
Similar Demographics by Professional Degree
Demographics Similar to Ecuadorians by Professional Degree
In terms of professional degree, the demographic groups most similar to Ecuadorians are Cree (3.9%, a difference of 0.21%), Nicaraguan (3.9%, a difference of 0.46%), Immigrants from Philippines (3.9%, a difference of 0.47%), Nonimmigrants (3.9%, a difference of 0.52%), and Immigrants from Barbados (3.9%, a difference of 0.53%).
| Demographics | Rating | Rank | Professional Degree |
| Trinidadians and Tobagonians | 7.1 /100 | #224 | Tragic 4.0% |
| Tlingit-Haida | 6.9 /100 | #225 | Tragic 4.0% |
| German Russians | 6.1 /100 | #226 | Tragic 4.0% |
| Cubans | 5.9 /100 | #227 | Tragic 4.0% |
| Immigrants | West Indies | 5.6 /100 | #228 | Tragic 4.0% |
| Immigrants | Burma/Myanmar | 5.4 /100 | #229 | Tragic 3.9% |
| Nicaraguans | 5.1 /100 | #230 | Tragic 3.9% |
| Ecuadorians | 4.6 /100 | #231 | Tragic 3.9% |
| Cree | 4.3 /100 | #232 | Tragic 3.9% |
| Immigrants | Philippines | 4.1 /100 | #233 | Tragic 3.9% |
| Immigrants | Nonimmigrants | 4.0 /100 | #234 | Tragic 3.9% |
| Immigrants | Barbados | 4.0 /100 | #235 | Tragic 3.9% |
| Spanish Americans | 3.8 /100 | #236 | Tragic 3.9% |
| Immigrants | Trinidad and Tobago | 3.8 /100 | #237 | Tragic 3.9% |
| Colville | 2.6 /100 | #238 | Tragic 3.8% |
Demographics Similar to Immigrants from North Macedonia by Professional Degree
In terms of professional degree, the demographic groups most similar to Immigrants from North Macedonia are Norwegian (4.2%, a difference of 0.080%), Finnish (4.2%, a difference of 0.36%), Immigrants from Middle Africa (4.2%, a difference of 0.44%), Czechoslovakian (4.2%, a difference of 0.50%), and Spanish (4.2%, a difference of 0.64%).
| Demographics | Rating | Rank | Professional Degree |
| French | 27.1 /100 | #193 | Fair 4.2% |
| Scandinavians | 25.8 /100 | #194 | Fair 4.2% |
| Nigerians | 24.6 /100 | #195 | Fair 4.2% |
| Spanish | 23.0 /100 | #196 | Fair 4.2% |
| Czechoslovakians | 22.4 /100 | #197 | Fair 4.2% |
| Immigrants | Middle Africa | 22.1 /100 | #198 | Fair 4.2% |
| Norwegians | 20.5 /100 | #199 | Fair 4.2% |
| Immigrants | North Macedonia | 20.2 /100 | #200 | Fair 4.2% |
| Finns | 18.7 /100 | #201 | Poor 4.2% |
| Immigrants | Iraq | 17.1 /100 | #202 | Poor 4.2% |
| Panamanians | 15.9 /100 | #203 | Poor 4.1% |
| Barbadians | 15.8 /100 | #204 | Poor 4.1% |
| Somalis | 14.8 /100 | #205 | Poor 4.1% |
| Yugoslavians | 13.4 /100 | #206 | Poor 4.1% |
| Sub-Saharan Africans | 12.8 /100 | #207 | Poor 4.1% |