Palestinian vs Immigrants from North Macedonia Median Family Income
COMPARE
Palestinian
Immigrants from North Macedonia
Median Family Income
Median Family Income Comparison
Palestinians
Immigrants from North Macedonia
$109,413
MEDIAN FAMILY INCOME
96.9/ 100
METRIC RATING
104th/ 347
METRIC RANK
$109,136
MEDIAN FAMILY INCOME
96.4/ 100
METRIC RATING
107th/ 347
METRIC RANK
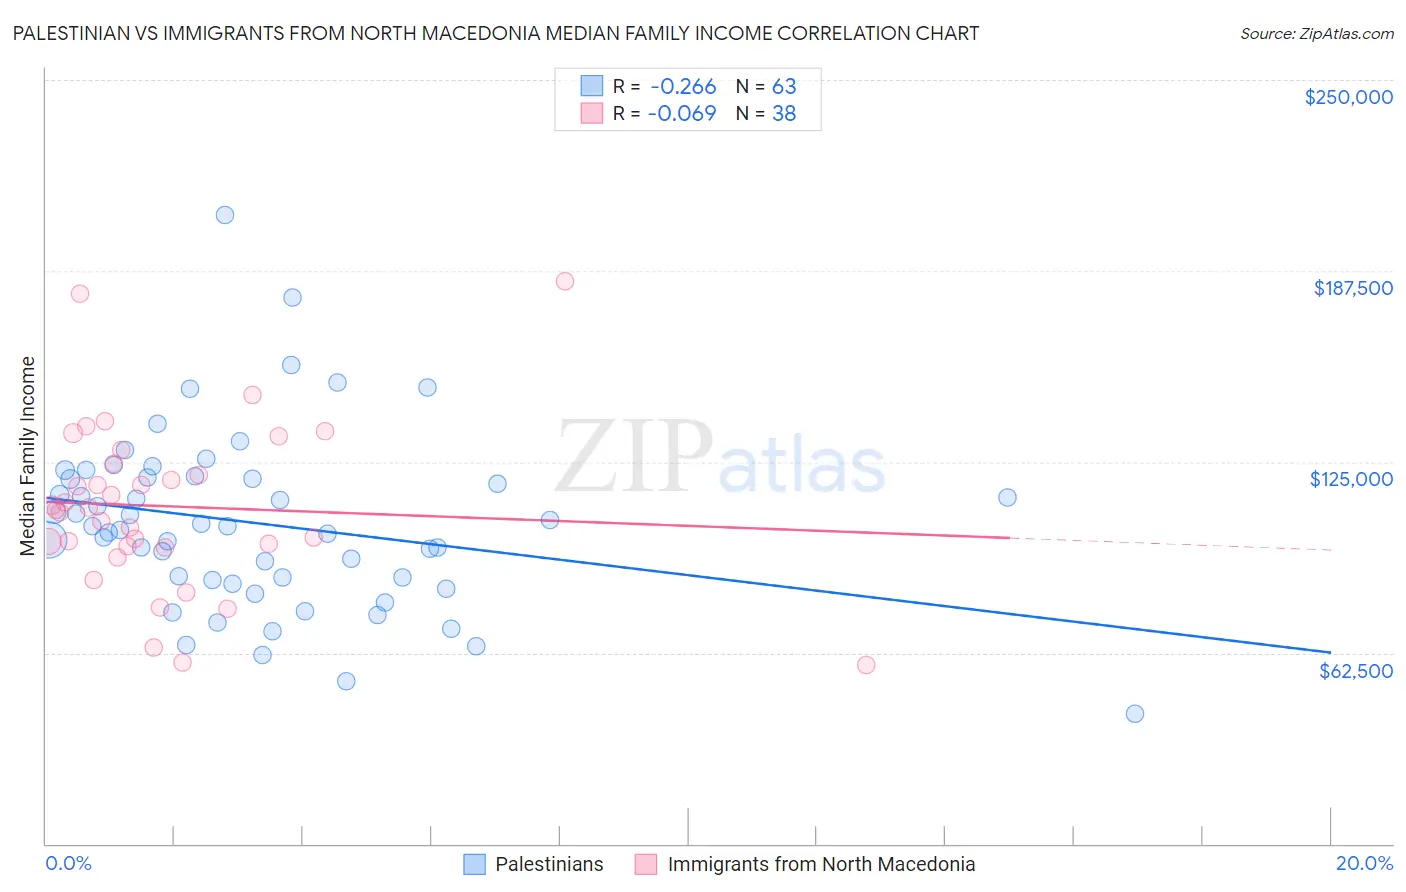
Palestinian vs Immigrants from North Macedonia Median Family Income Correlation Chart
The statistical analysis conducted on geographies consisting of 216,343,978 people shows a weak negative correlation between the proportion of Palestinians and median family income in the United States with a correlation coefficient (R) of -0.266 and weighted average of $109,413. Similarly, the statistical analysis conducted on geographies consisting of 74,300,796 people shows a slight negative correlation between the proportion of Immigrants from North Macedonia and median family income in the United States with a correlation coefficient (R) of -0.069 and weighted average of $109,136, a difference of 0.25%.
Median Family Income Correlation Summary
| Measurement | Palestinian | Immigrants from North Macedonia |
| Minimum | $42,500 | $58,625 |
| Maximum | $205,817 | $184,091 |
| Range | $163,317 | $125,466 |
| Mean | $104,822 | $110,416 |
| Median | $104,046 | $109,646 |
| Interquartile 25% (IQ1) | $86,157 | $97,322 |
| Interquartile 75% (IQ3) | $120,000 | $124,196 |
| Interquartile Range (IQR) | $33,843 | $26,874 |
| Standard Deviation (Sample) | $28,885 | $27,502 |
| Standard Deviation (Population) | $28,655 | $27,137 |
Demographics Similar to Palestinians and Immigrants from North Macedonia by Median Family Income
In terms of median family income, the demographic groups most similar to Palestinians are Immigrants from Brazil ($109,418, a difference of 0.0%), Syrian ($109,299, a difference of 0.10%), Assyrian/Chaldean/Syriac ($109,622, a difference of 0.19%), Immigrants from Ukraine ($109,645, a difference of 0.21%), and Macedonian ($109,668, a difference of 0.23%). Similarly, the demographic groups most similar to Immigrants from North Macedonia are Albanian ($109,136, a difference of 0.0%), Syrian ($109,299, a difference of 0.15%), Immigrants from Brazil ($109,418, a difference of 0.26%), Immigrants from Zimbabwe ($108,830, a difference of 0.28%), and Immigrants from Afghanistan ($108,709, a difference of 0.39%).
| Demographics | Rating | Rank | Median Family Income |
| Zimbabweans | 97.7 /100 | #95 | Exceptional $110,011 |
| Immigrants | Moldova | 97.7 /100 | #96 | Exceptional $109,975 |
| Jordanians | 97.5 /100 | #97 | Exceptional $109,865 |
| Immigrants | Kuwait | 97.4 /100 | #98 | Exceptional $109,731 |
| Armenians | 97.3 /100 | #99 | Exceptional $109,692 |
| Macedonians | 97.3 /100 | #100 | Exceptional $109,668 |
| Immigrants | Ukraine | 97.2 /100 | #101 | Exceptional $109,645 |
| Assyrians/Chaldeans/Syriacs | 97.2 /100 | #102 | Exceptional $109,622 |
| Immigrants | Brazil | 96.9 /100 | #103 | Exceptional $109,418 |
| Palestinians | 96.9 /100 | #104 | Exceptional $109,413 |
| Syrians | 96.7 /100 | #105 | Exceptional $109,299 |
| Albanians | 96.4 /100 | #106 | Exceptional $109,136 |
| Immigrants | North Macedonia | 96.4 /100 | #107 | Exceptional $109,136 |
| Immigrants | Zimbabwe | 95.9 /100 | #108 | Exceptional $108,830 |
| Immigrants | Afghanistan | 95.6 /100 | #109 | Exceptional $108,709 |
| British | 95.6 /100 | #110 | Exceptional $108,705 |
| Immigrants | Western Asia | 95.6 /100 | #111 | Exceptional $108,691 |
| Immigrants | Poland | 95.3 /100 | #112 | Exceptional $108,570 |
| Immigrants | Saudi Arabia | 95.2 /100 | #113 | Exceptional $108,544 |
| Poles | 95.2 /100 | #114 | Exceptional $108,507 |
| Swedes | 95.1 /100 | #115 | Exceptional $108,499 |