Ecuadorian vs Immigrants from Mexico Median Family Income
COMPARE
Ecuadorian
Immigrants from Mexico
Median Family Income
Median Family Income Comparison
Ecuadorians
Immigrants from Mexico
$95,114
MEDIAN FAMILY INCOME
2.1/ 100
METRIC RATING
231st/ 347
METRIC RANK
$83,639
MEDIAN FAMILY INCOME
0.0/ 100
METRIC RATING
318th/ 347
METRIC RANK
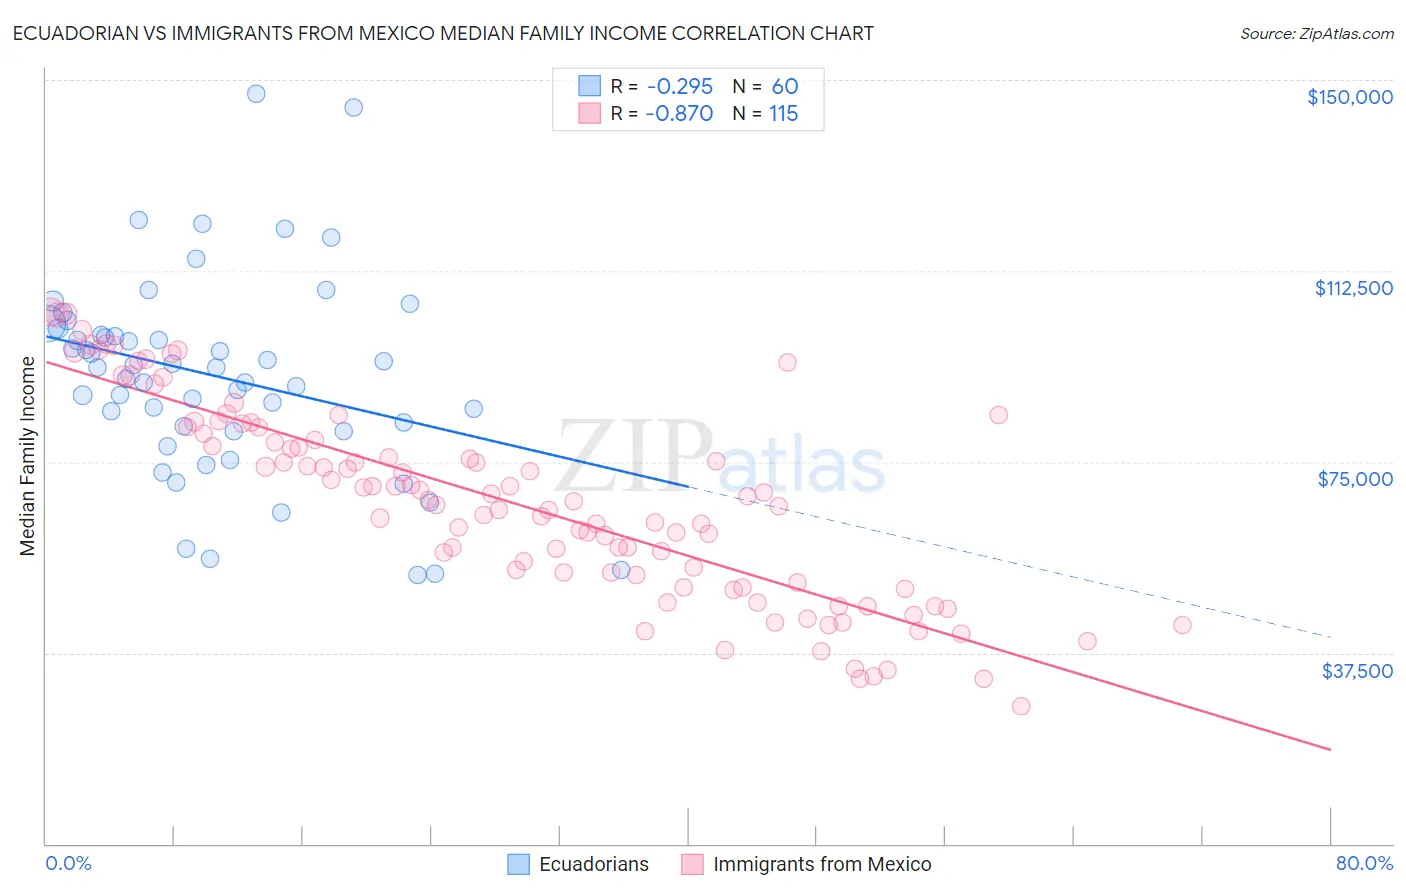
Ecuadorian vs Immigrants from Mexico Median Family Income Correlation Chart
The statistical analysis conducted on geographies consisting of 317,539,775 people shows a weak negative correlation between the proportion of Ecuadorians and median family income in the United States with a correlation coefficient (R) of -0.295 and weighted average of $95,114. Similarly, the statistical analysis conducted on geographies consisting of 512,958,720 people shows a very strong negative correlation between the proportion of Immigrants from Mexico and median family income in the United States with a correlation coefficient (R) of -0.870 and weighted average of $83,639, a difference of 13.7%.
Median Family Income Correlation Summary
| Measurement | Ecuadorian | Immigrants from Mexico |
| Minimum | $52,846 | $27,125 |
| Maximum | $147,371 | $104,446 |
| Range | $94,525 | $77,321 |
| Mean | $91,870 | $66,857 |
| Median | $93,530 | $67,328 |
| Interquartile 25% (IQ1) | $81,441 | $51,313 |
| Interquartile 75% (IQ3) | $100,588 | $80,504 |
| Interquartile Range (IQR) | $19,147 | $29,191 |
| Standard Deviation (Sample) | $19,583 | $19,043 |
| Standard Deviation (Population) | $19,420 | $18,960 |
Similar Demographics by Median Family Income
Demographics Similar to Ecuadorians by Median Family Income
In terms of median family income, the demographic groups most similar to Ecuadorians are Malaysian ($95,230, a difference of 0.12%), Marshallese ($95,293, a difference of 0.19%), Immigrants from Venezuela ($94,904, a difference of 0.22%), Immigrants from the Azores ($95,402, a difference of 0.30%), and Immigrants from Bangladesh ($94,665, a difference of 0.47%).
| Demographics | Rating | Rank | Median Family Income |
| Immigrants | Nonimmigrants | 3.6 /100 | #224 | Tragic $96,231 |
| Vietnamese | 3.4 /100 | #225 | Tragic $96,123 |
| Immigrants | Panama | 2.7 /100 | #226 | Tragic $95,647 |
| Alaska Natives | 2.6 /100 | #227 | Tragic $95,573 |
| Immigrants | Azores | 2.4 /100 | #228 | Tragic $95,402 |
| Marshallese | 2.2 /100 | #229 | Tragic $95,293 |
| Malaysians | 2.2 /100 | #230 | Tragic $95,230 |
| Ecuadorians | 2.1 /100 | #231 | Tragic $95,114 |
| Immigrants | Venezuela | 1.9 /100 | #232 | Tragic $94,904 |
| Immigrants | Bangladesh | 1.6 /100 | #233 | Tragic $94,665 |
| Immigrants | Western Africa | 1.6 /100 | #234 | Tragic $94,638 |
| Immigrants | Burma/Myanmar | 1.5 /100 | #235 | Tragic $94,472 |
| Trinidadians and Tobagonians | 1.5 /100 | #236 | Tragic $94,466 |
| Alaskan Athabascans | 1.5 /100 | #237 | Tragic $94,429 |
| Nepalese | 1.3 /100 | #238 | Tragic $94,153 |
Demographics Similar to Immigrants from Mexico by Median Family Income
In terms of median family income, the demographic groups most similar to Immigrants from Mexico are Immigrants from Honduras ($83,618, a difference of 0.030%), Seminole ($83,354, a difference of 0.34%), Yakama ($83,932, a difference of 0.35%), Immigrants from Caribbean ($83,319, a difference of 0.38%), and Immigrants from Haiti ($84,018, a difference of 0.45%).
| Demographics | Rating | Rank | Median Family Income |
| Hondurans | 0.0 /100 | #311 | Tragic $85,004 |
| Cubans | 0.0 /100 | #312 | Tragic $84,981 |
| Choctaw | 0.0 /100 | #313 | Tragic $84,835 |
| Immigrants | Bahamas | 0.0 /100 | #314 | Tragic $84,732 |
| Apache | 0.0 /100 | #315 | Tragic $84,451 |
| Immigrants | Haiti | 0.0 /100 | #316 | Tragic $84,018 |
| Yakama | 0.0 /100 | #317 | Tragic $83,932 |
| Immigrants | Mexico | 0.0 /100 | #318 | Tragic $83,639 |
| Immigrants | Honduras | 0.0 /100 | #319 | Tragic $83,618 |
| Seminole | 0.0 /100 | #320 | Tragic $83,354 |
| Immigrants | Caribbean | 0.0 /100 | #321 | Tragic $83,319 |
| Dominicans | 0.0 /100 | #322 | Tragic $82,888 |
| Bahamians | 0.0 /100 | #323 | Tragic $82,631 |
| Creek | 0.0 /100 | #324 | Tragic $82,560 |
| Sioux | 0.0 /100 | #325 | Tragic $82,386 |