Ecuadorian vs Immigrants from Latvia Median Family Income
COMPARE
Ecuadorian
Immigrants from Latvia
Median Family Income
Median Family Income Comparison
Ecuadorians
Immigrants from Latvia
$95,114
MEDIAN FAMILY INCOME
2.1/ 100
METRIC RATING
231st/ 347
METRIC RANK
$114,826
MEDIAN FAMILY INCOME
99.8/ 100
METRIC RATING
60th/ 347
METRIC RANK
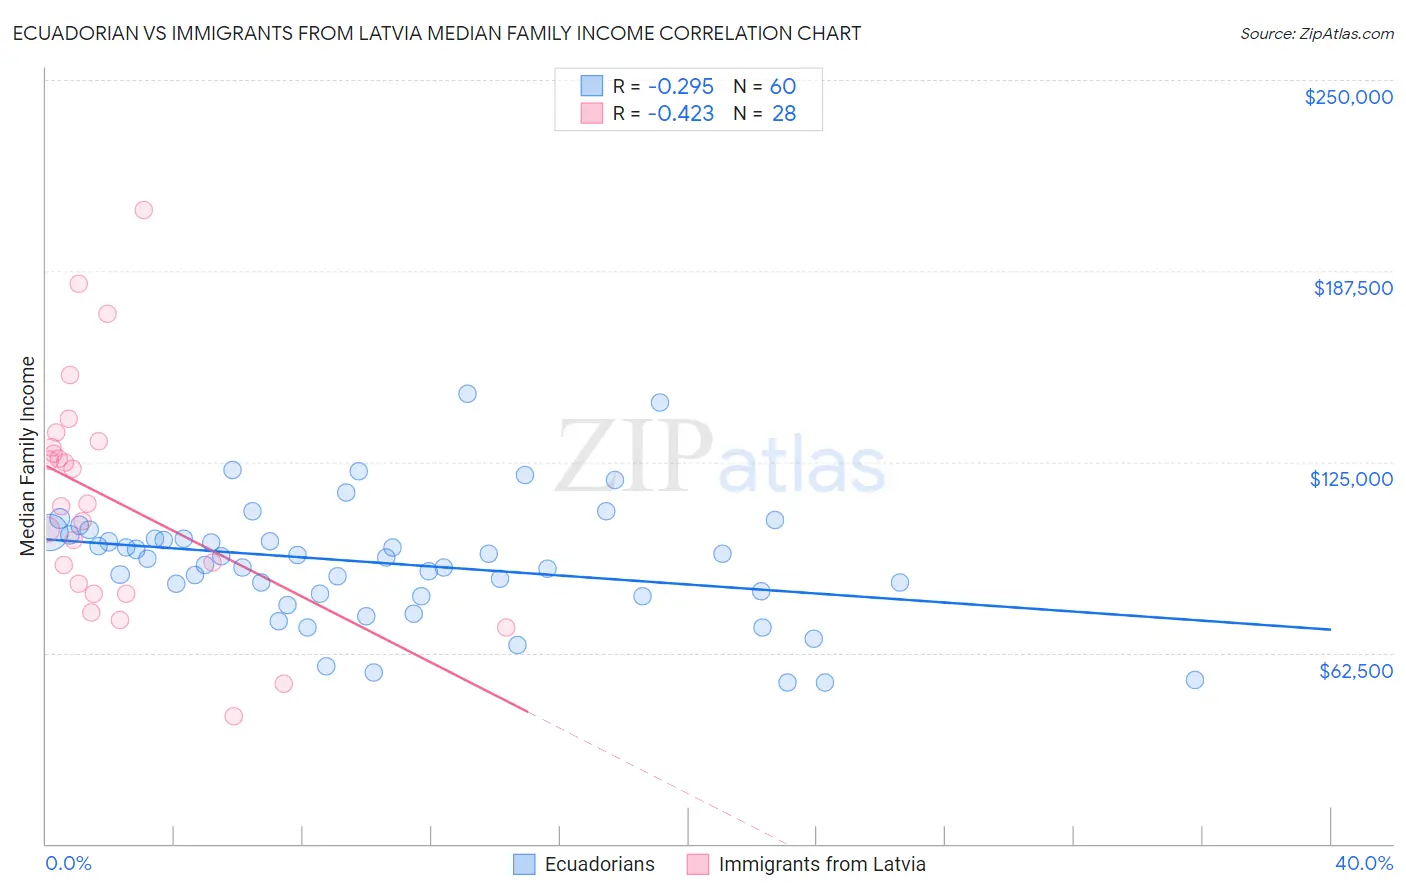
Ecuadorian vs Immigrants from Latvia Median Family Income Correlation Chart
The statistical analysis conducted on geographies consisting of 317,539,775 people shows a weak negative correlation between the proportion of Ecuadorians and median family income in the United States with a correlation coefficient (R) of -0.295 and weighted average of $95,114. Similarly, the statistical analysis conducted on geographies consisting of 113,722,830 people shows a moderate negative correlation between the proportion of Immigrants from Latvia and median family income in the United States with a correlation coefficient (R) of -0.423 and weighted average of $114,826, a difference of 20.7%.
Median Family Income Correlation Summary
| Measurement | Ecuadorian | Immigrants from Latvia |
| Minimum | $52,846 | $41,641 |
| Maximum | $147,371 | $207,328 |
| Range | $94,525 | $165,687 |
| Mean | $91,870 | $112,663 |
| Median | $93,530 | $110,782 |
| Interquartile 25% (IQ1) | $81,441 | $83,546 |
| Interquartile 75% (IQ3) | $100,588 | $130,754 |
| Interquartile Range (IQR) | $19,147 | $47,207 |
| Standard Deviation (Sample) | $19,583 | $38,081 |
| Standard Deviation (Population) | $19,420 | $37,395 |
Similar Demographics by Median Family Income
Demographics Similar to Ecuadorians by Median Family Income
In terms of median family income, the demographic groups most similar to Ecuadorians are Malaysian ($95,230, a difference of 0.12%), Marshallese ($95,293, a difference of 0.19%), Immigrants from Venezuela ($94,904, a difference of 0.22%), Immigrants from the Azores ($95,402, a difference of 0.30%), and Immigrants from Bangladesh ($94,665, a difference of 0.47%).
| Demographics | Rating | Rank | Median Family Income |
| Immigrants | Nonimmigrants | 3.6 /100 | #224 | Tragic $96,231 |
| Vietnamese | 3.4 /100 | #225 | Tragic $96,123 |
| Immigrants | Panama | 2.7 /100 | #226 | Tragic $95,647 |
| Alaska Natives | 2.6 /100 | #227 | Tragic $95,573 |
| Immigrants | Azores | 2.4 /100 | #228 | Tragic $95,402 |
| Marshallese | 2.2 /100 | #229 | Tragic $95,293 |
| Malaysians | 2.2 /100 | #230 | Tragic $95,230 |
| Ecuadorians | 2.1 /100 | #231 | Tragic $95,114 |
| Immigrants | Venezuela | 1.9 /100 | #232 | Tragic $94,904 |
| Immigrants | Bangladesh | 1.6 /100 | #233 | Tragic $94,665 |
| Immigrants | Western Africa | 1.6 /100 | #234 | Tragic $94,638 |
| Immigrants | Burma/Myanmar | 1.5 /100 | #235 | Tragic $94,472 |
| Trinidadians and Tobagonians | 1.5 /100 | #236 | Tragic $94,466 |
| Alaskan Athabascans | 1.5 /100 | #237 | Tragic $94,429 |
| Nepalese | 1.3 /100 | #238 | Tragic $94,153 |
Demographics Similar to Immigrants from Latvia by Median Family Income
In terms of median family income, the demographic groups most similar to Immigrants from Latvia are Immigrants from Netherlands ($114,987, a difference of 0.14%), Immigrants from Belarus ($114,586, a difference of 0.21%), Mongolian ($114,553, a difference of 0.24%), Immigrants from Indonesia ($115,162, a difference of 0.29%), and Greek ($115,192, a difference of 0.32%).
| Demographics | Rating | Rank | Median Family Income |
| Immigrants | Norway | 99.9 /100 | #53 | Exceptional $115,847 |
| Immigrants | Europe | 99.9 /100 | #54 | Exceptional $115,523 |
| Lithuanians | 99.8 /100 | #55 | Exceptional $115,395 |
| New Zealanders | 99.8 /100 | #56 | Exceptional $115,230 |
| Greeks | 99.8 /100 | #57 | Exceptional $115,192 |
| Immigrants | Indonesia | 99.8 /100 | #58 | Exceptional $115,162 |
| Immigrants | Netherlands | 99.8 /100 | #59 | Exceptional $114,987 |
| Immigrants | Latvia | 99.8 /100 | #60 | Exceptional $114,826 |
| Immigrants | Belarus | 99.8 /100 | #61 | Exceptional $114,586 |
| Mongolians | 99.8 /100 | #62 | Exceptional $114,553 |
| Immigrants | Pakistan | 99.8 /100 | #63 | Exceptional $114,406 |
| Immigrants | Scotland | 99.7 /100 | #64 | Exceptional $114,392 |
| Egyptians | 99.7 /100 | #65 | Exceptional $114,119 |
| Paraguayans | 99.7 /100 | #66 | Exceptional $114,016 |
| Immigrants | Spain | 99.7 /100 | #67 | Exceptional $113,815 |