Immigrants from Romania vs Immigrants from Czechoslovakia Median Earnings
COMPARE
Immigrants from Romania
Immigrants from Czechoslovakia
Median Earnings
Median Earnings Comparison
Immigrants from Romania
Immigrants from Czechoslovakia
$51,337
MEDIAN EARNINGS
99.9/ 100
METRIC RATING
62nd/ 347
METRIC RANK
$52,361
MEDIAN EARNINGS
100.0/ 100
METRIC RATING
45th/ 347
METRIC RANK
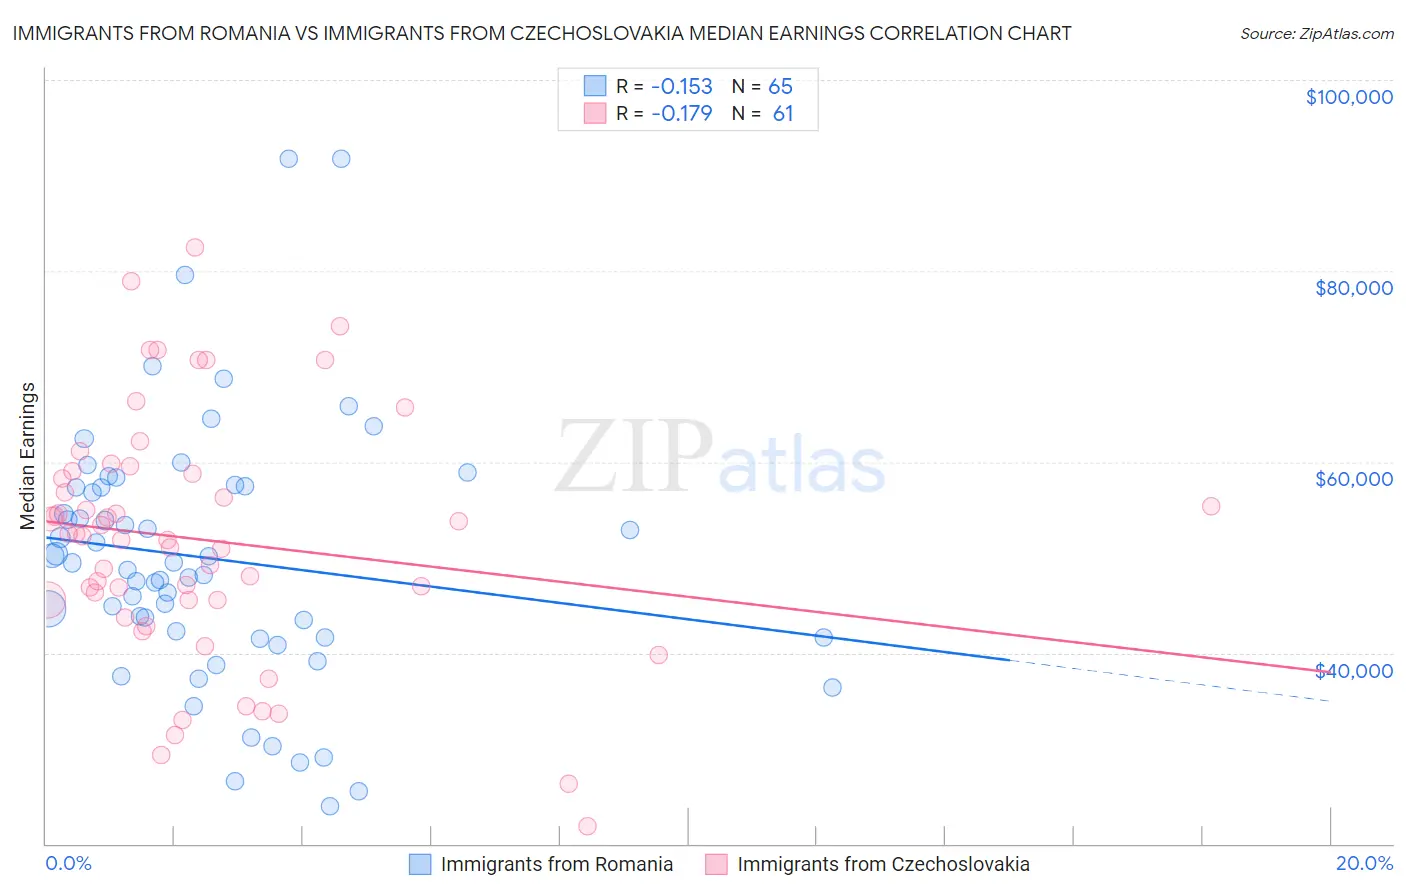
Immigrants from Romania vs Immigrants from Czechoslovakia Median Earnings Correlation Chart
The statistical analysis conducted on geographies consisting of 257,003,110 people shows a poor negative correlation between the proportion of Immigrants from Romania and median earnings in the United States with a correlation coefficient (R) of -0.153 and weighted average of $51,337. Similarly, the statistical analysis conducted on geographies consisting of 195,449,585 people shows a poor negative correlation between the proportion of Immigrants from Czechoslovakia and median earnings in the United States with a correlation coefficient (R) of -0.179 and weighted average of $52,361, a difference of 2.0%.
Median Earnings Correlation Summary
| Measurement | Immigrants from Romania | Immigrants from Czechoslovakia |
| Minimum | $23,864 | $21,875 |
| Maximum | $91,786 | $82,450 |
| Range | $67,922 | $60,575 |
| Mean | $49,856 | $51,817 |
| Median | $49,415 | $52,166 |
| Interquartile 25% (IQ1) | $41,640 | $45,495 |
| Interquartile 75% (IQ3) | $57,433 | $58,910 |
| Interquartile Range (IQR) | $15,793 | $13,415 |
| Standard Deviation (Sample) | $13,572 | $12,779 |
| Standard Deviation (Population) | $13,467 | $12,674 |
Demographics Similar to Immigrants from Romania and Immigrants from Czechoslovakia by Median Earnings
In terms of median earnings, the demographic groups most similar to Immigrants from Romania are Immigrants from Bulgaria ($51,318, a difference of 0.040%), Immigrants from Latvia ($51,555, a difference of 0.42%), Immigrants from Serbia ($51,557, a difference of 0.43%), Immigrants from Croatia ($51,581, a difference of 0.47%), and Immigrants from Bolivia ($51,605, a difference of 0.52%). Similarly, the demographic groups most similar to Immigrants from Czechoslovakia are Bhutanese ($52,297, a difference of 0.12%), Australian ($52,294, a difference of 0.13%), Immigrants from Malaysia ($52,514, a difference of 0.29%), Bulgarian ($52,512, a difference of 0.29%), and Immigrants from Europe ($52,195, a difference of 0.32%).
| Demographics | Rating | Rank | Median Earnings |
| Immigrants | Malaysia | 100.0 /100 | #43 | Exceptional $52,514 |
| Bulgarians | 100.0 /100 | #44 | Exceptional $52,512 |
| Immigrants | Czechoslovakia | 100.0 /100 | #45 | Exceptional $52,361 |
| Bhutanese | 100.0 /100 | #46 | Exceptional $52,297 |
| Australians | 100.0 /100 | #47 | Exceptional $52,294 |
| Immigrants | Europe | 100.0 /100 | #48 | Exceptional $52,195 |
| Bolivians | 100.0 /100 | #49 | Exceptional $52,005 |
| Immigrants | South Africa | 100.0 /100 | #50 | Exceptional $51,850 |
| Immigrants | Austria | 99.9 /100 | #51 | Exceptional $51,826 |
| Estonians | 99.9 /100 | #52 | Exceptional $51,772 |
| Immigrants | Norway | 99.9 /100 | #53 | Exceptional $51,758 |
| Immigrants | Indonesia | 99.9 /100 | #54 | Exceptional $51,715 |
| Egyptians | 99.9 /100 | #55 | Exceptional $51,701 |
| Immigrants | Pakistan | 99.9 /100 | #56 | Exceptional $51,693 |
| Immigrants | Eastern Europe | 99.9 /100 | #57 | Exceptional $51,624 |
| Immigrants | Bolivia | 99.9 /100 | #58 | Exceptional $51,605 |
| Immigrants | Croatia | 99.9 /100 | #59 | Exceptional $51,581 |
| Immigrants | Serbia | 99.9 /100 | #60 | Exceptional $51,557 |
| Immigrants | Latvia | 99.9 /100 | #61 | Exceptional $51,555 |
| Immigrants | Romania | 99.9 /100 | #62 | Exceptional $51,337 |
| Immigrants | Bulgaria | 99.9 /100 | #63 | Exceptional $51,318 |