Asian vs Immigrants from Czechoslovakia Median Earnings
COMPARE
Asian
Immigrants from Czechoslovakia
Median Earnings
Median Earnings Comparison
Asians
Immigrants from Czechoslovakia
$53,690
MEDIAN EARNINGS
100.0/ 100
METRIC RATING
27th/ 347
METRIC RANK
$52,361
MEDIAN EARNINGS
100.0/ 100
METRIC RATING
45th/ 347
METRIC RANK
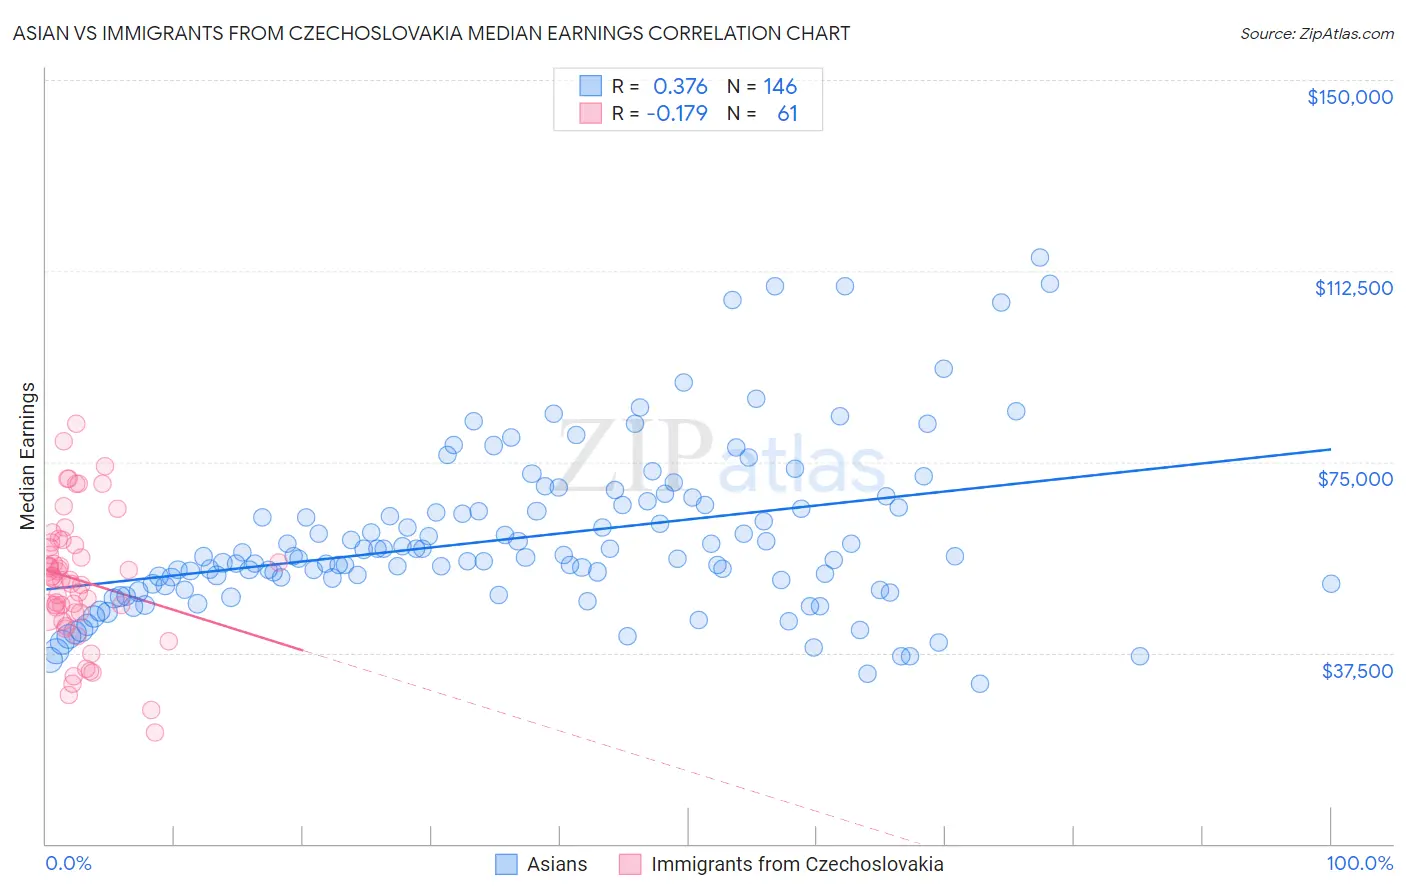
Asian vs Immigrants from Czechoslovakia Median Earnings Correlation Chart
The statistical analysis conducted on geographies consisting of 550,727,448 people shows a mild positive correlation between the proportion of Asians and median earnings in the United States with a correlation coefficient (R) of 0.376 and weighted average of $53,690. Similarly, the statistical analysis conducted on geographies consisting of 195,449,585 people shows a poor negative correlation between the proportion of Immigrants from Czechoslovakia and median earnings in the United States with a correlation coefficient (R) of -0.179 and weighted average of $52,361, a difference of 2.5%.
Median Earnings Correlation Summary
| Measurement | Asian | Immigrants from Czechoslovakia |
| Minimum | $31,416 | $21,875 |
| Maximum | $115,028 | $82,450 |
| Range | $83,612 | $60,575 |
| Mean | $60,136 | $51,817 |
| Median | $56,241 | $52,166 |
| Interquartile 25% (IQ1) | $50,602 | $45,495 |
| Interquartile 75% (IQ3) | $66,425 | $58,910 |
| Interquartile Range (IQR) | $15,823 | $13,415 |
| Standard Deviation (Sample) | $16,173 | $12,779 |
| Standard Deviation (Population) | $16,117 | $12,674 |
Demographics Similar to Asians and Immigrants from Czechoslovakia by Median Earnings
In terms of median earnings, the demographic groups most similar to Asians are Immigrants from Northern Europe ($53,872, a difference of 0.34%), Immigrants from France ($53,490, a difference of 0.37%), Immigrants from Russia ($53,457, a difference of 0.43%), Cambodian ($53,386, a difference of 0.57%), and Russian ($53,334, a difference of 0.67%). Similarly, the demographic groups most similar to Immigrants from Czechoslovakia are Bhutanese ($52,297, a difference of 0.12%), Immigrants from Malaysia ($52,514, a difference of 0.29%), Bulgarian ($52,512, a difference of 0.29%), Maltese ($52,526, a difference of 0.31%), and Immigrants from Lithuania ($52,769, a difference of 0.78%).
| Demographics | Rating | Rank | Median Earnings |
| Immigrants | Northern Europe | 100.0 /100 | #26 | Exceptional $53,872 |
| Asians | 100.0 /100 | #27 | Exceptional $53,690 |
| Immigrants | France | 100.0 /100 | #28 | Exceptional $53,490 |
| Immigrants | Russia | 100.0 /100 | #29 | Exceptional $53,457 |
| Cambodians | 100.0 /100 | #30 | Exceptional $53,386 |
| Russians | 100.0 /100 | #31 | Exceptional $53,334 |
| Immigrants | Asia | 100.0 /100 | #32 | Exceptional $53,310 |
| Immigrants | Greece | 100.0 /100 | #33 | Exceptional $53,282 |
| Immigrants | Sri Lanka | 100.0 /100 | #34 | Exceptional $53,268 |
| Immigrants | Switzerland | 100.0 /100 | #35 | Exceptional $53,211 |
| Immigrants | Denmark | 100.0 /100 | #36 | Exceptional $53,186 |
| Immigrants | Belarus | 100.0 /100 | #37 | Exceptional $53,043 |
| Latvians | 100.0 /100 | #38 | Exceptional $53,001 |
| Immigrants | Turkey | 100.0 /100 | #39 | Exceptional $52,960 |
| Israelis | 100.0 /100 | #40 | Exceptional $52,937 |
| Immigrants | Lithuania | 100.0 /100 | #41 | Exceptional $52,769 |
| Maltese | 100.0 /100 | #42 | Exceptional $52,526 |
| Immigrants | Malaysia | 100.0 /100 | #43 | Exceptional $52,514 |
| Bulgarians | 100.0 /100 | #44 | Exceptional $52,512 |
| Immigrants | Czechoslovakia | 100.0 /100 | #45 | Exceptional $52,361 |
| Bhutanese | 100.0 /100 | #46 | Exceptional $52,297 |