Dutch West Indian vs Filipino Median Female Earnings
COMPARE
Dutch West Indian
Filipino
Median Female Earnings
Median Female Earnings Comparison
Dutch West Indians
Filipinos
$34,106
MEDIAN FEMALE EARNINGS
0.0/ 100
METRIC RATING
325th/ 347
METRIC RANK
$49,508
MEDIAN FEMALE EARNINGS
100.0/ 100
METRIC RATING
2nd/ 347
METRIC RANK
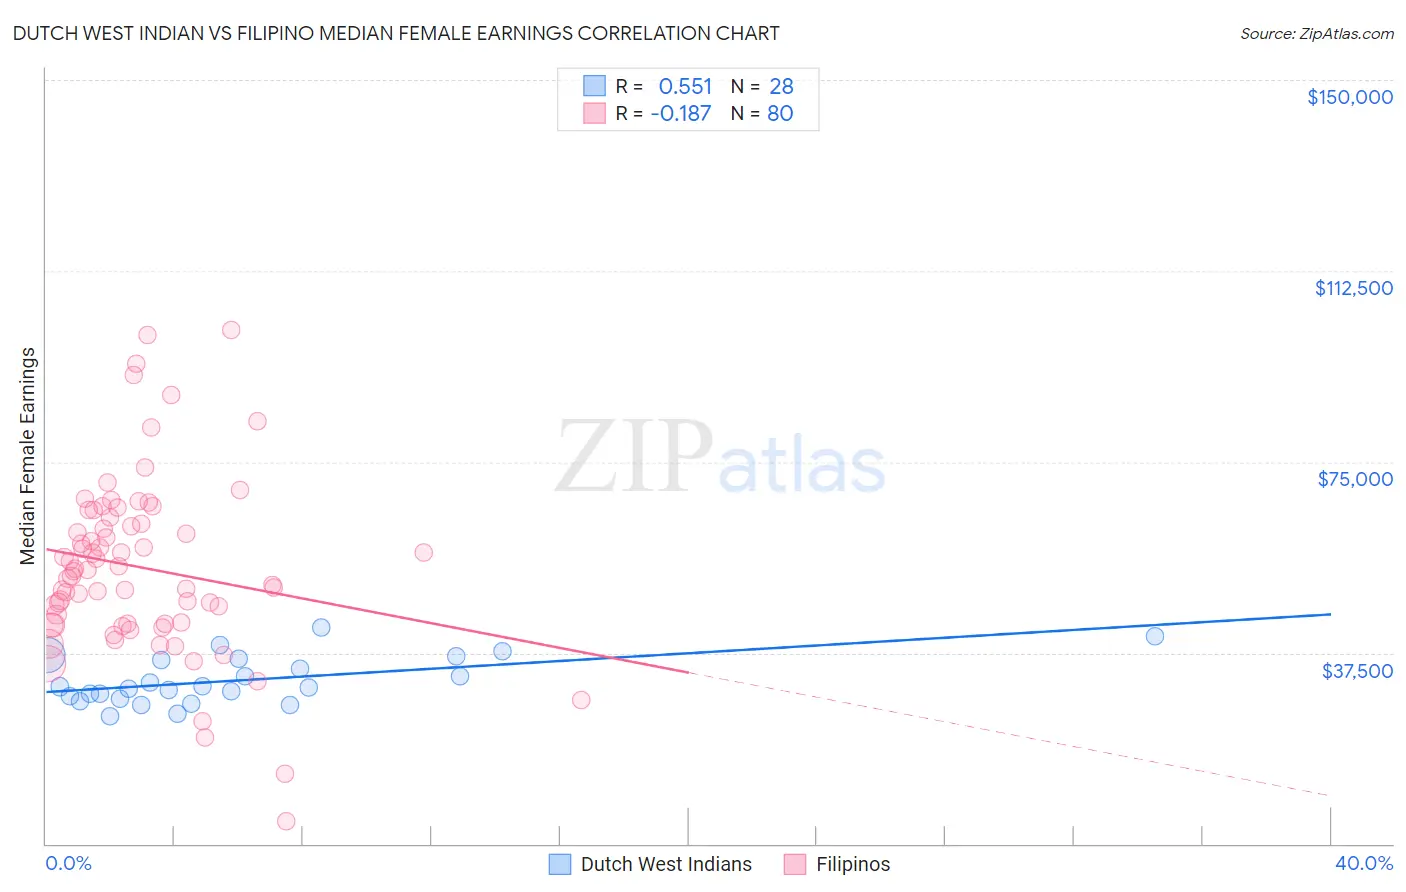
Dutch West Indian vs Filipino Median Female Earnings Correlation Chart
The statistical analysis conducted on geographies consisting of 85,733,523 people shows a substantial positive correlation between the proportion of Dutch West Indians and median female earnings in the United States with a correlation coefficient (R) of 0.551 and weighted average of $34,106. Similarly, the statistical analysis conducted on geographies consisting of 254,323,298 people shows a poor negative correlation between the proportion of Filipinos and median female earnings in the United States with a correlation coefficient (R) of -0.187 and weighted average of $49,508, a difference of 45.2%.
Median Female Earnings Correlation Summary
| Measurement | Dutch West Indian | Filipino |
| Minimum | $25,030 | $4,500 |
| Maximum | $42,538 | $100,821 |
| Range | $17,508 | $96,321 |
| Mean | $32,091 | $54,231 |
| Median | $30,746 | $53,668 |
| Interquartile 25% (IQ1) | $28,657 | $43,160 |
| Interquartile 75% (IQ3) | $36,289 | $63,449 |
| Interquartile Range (IQR) | $7,632 | $20,289 |
| Standard Deviation (Sample) | $4,662 | $17,351 |
| Standard Deviation (Population) | $4,578 | $17,242 |
Similar Demographics by Median Female Earnings
Demographics Similar to Dutch West Indians by Median Female Earnings
In terms of median female earnings, the demographic groups most similar to Dutch West Indians are Kiowa ($34,074, a difference of 0.090%), Cajun ($34,034, a difference of 0.21%), Immigrants from Central America ($33,953, a difference of 0.45%), Hopi ($33,932, a difference of 0.51%), and Immigrants from Congo ($34,317, a difference of 0.62%).
| Demographics | Rating | Rank | Median Female Earnings |
| Immigrants | Yemen | 0.0 /100 | #318 | Tragic $34,693 |
| Shoshone | 0.0 /100 | #319 | Tragic $34,677 |
| Immigrants | Honduras | 0.0 /100 | #320 | Tragic $34,647 |
| Hispanics or Latinos | 0.0 /100 | #321 | Tragic $34,421 |
| Chickasaw | 0.0 /100 | #322 | Tragic $34,414 |
| Seminole | 0.0 /100 | #323 | Tragic $34,385 |
| Immigrants | Congo | 0.0 /100 | #324 | Tragic $34,317 |
| Dutch West Indians | 0.0 /100 | #325 | Tragic $34,106 |
| Kiowa | 0.0 /100 | #326 | Tragic $34,074 |
| Cajuns | 0.0 /100 | #327 | Tragic $34,034 |
| Immigrants | Central America | 0.0 /100 | #328 | Tragic $33,953 |
| Hopi | 0.0 /100 | #329 | Tragic $33,932 |
| Menominee | 0.0 /100 | #330 | Tragic $33,894 |
| Natives/Alaskans | 0.0 /100 | #331 | Tragic $33,806 |
| Choctaw | 0.0 /100 | #332 | Tragic $33,775 |
Demographics Similar to Filipinos by Median Female Earnings
In terms of median female earnings, the demographic groups most similar to Filipinos are Immigrants from Taiwan ($49,256, a difference of 0.51%), Immigrants from Hong Kong ($49,818, a difference of 0.63%), Immigrants from India ($48,292, a difference of 2.5%), Immigrants from Singapore ($47,986, a difference of 3.2%), and Immigrants from Ireland ($47,598, a difference of 4.0%).
| Demographics | Rating | Rank | Median Female Earnings |
| Immigrants | Hong Kong | 100.0 /100 | #1 | Exceptional $49,818 |
| Filipinos | 100.0 /100 | #2 | Exceptional $49,508 |
| Immigrants | Taiwan | 100.0 /100 | #3 | Exceptional $49,256 |
| Immigrants | India | 100.0 /100 | #4 | Exceptional $48,292 |
| Immigrants | Singapore | 100.0 /100 | #5 | Exceptional $47,986 |
| Immigrants | Ireland | 100.0 /100 | #6 | Exceptional $47,598 |
| Thais | 100.0 /100 | #7 | Exceptional $47,577 |
| Iranians | 100.0 /100 | #8 | Exceptional $47,421 |
| Immigrants | Iran | 100.0 /100 | #9 | Exceptional $47,154 |
| Immigrants | China | 100.0 /100 | #10 | Exceptional $46,972 |
| Okinawans | 100.0 /100 | #11 | Exceptional $46,905 |
| Immigrants | Israel | 100.0 /100 | #12 | Exceptional $46,902 |
| Immigrants | Australia | 100.0 /100 | #13 | Exceptional $46,573 |
| Soviet Union | 100.0 /100 | #14 | Exceptional $46,556 |
| Immigrants | Eastern Asia | 100.0 /100 | #15 | Exceptional $46,502 |