Dutch West Indian vs Yup'ik Median Female Earnings
COMPARE
Dutch West Indian
Yup'ik
Median Female Earnings
Median Female Earnings Comparison
Dutch West Indians
Yup'ik
$34,106
MEDIAN FEMALE EARNINGS
0.0/ 100
METRIC RATING
325th/ 347
METRIC RANK
$32,730
MEDIAN FEMALE EARNINGS
0.0/ 100
METRIC RATING
342nd/ 347
METRIC RANK
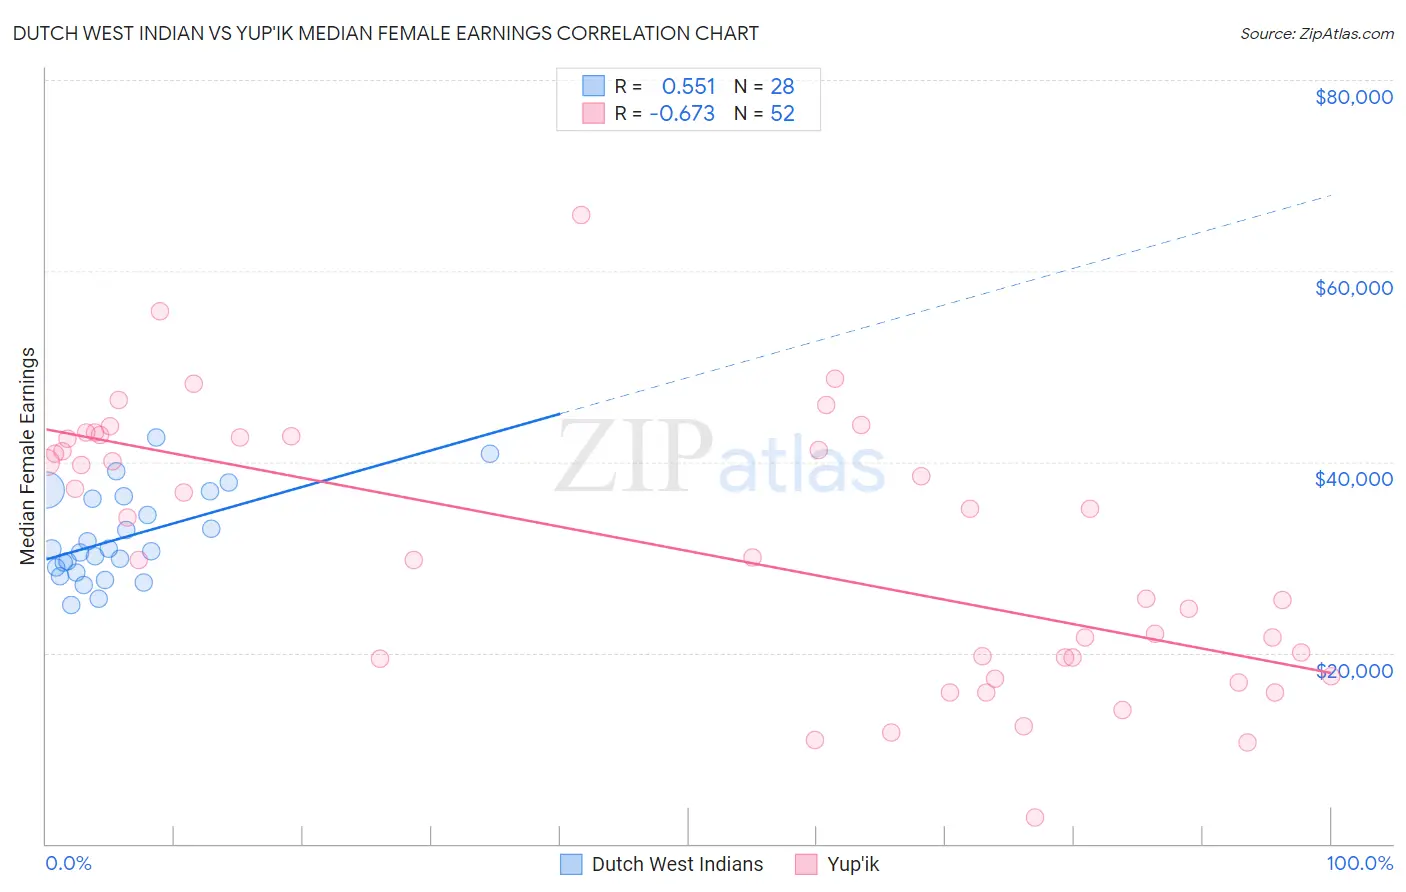
Dutch West Indian vs Yup'ik Median Female Earnings Correlation Chart
The statistical analysis conducted on geographies consisting of 85,733,523 people shows a substantial positive correlation between the proportion of Dutch West Indians and median female earnings in the United States with a correlation coefficient (R) of 0.551 and weighted average of $34,106. Similarly, the statistical analysis conducted on geographies consisting of 39,946,861 people shows a significant negative correlation between the proportion of Yup'ik and median female earnings in the United States with a correlation coefficient (R) of -0.673 and weighted average of $32,730, a difference of 4.2%.
Median Female Earnings Correlation Summary
| Measurement | Dutch West Indian | Yup'ik |
| Minimum | $25,030 | $2,800 |
| Maximum | $42,538 | $65,833 |
| Range | $17,508 | $63,033 |
| Mean | $32,091 | $30,861 |
| Median | $30,746 | $32,085 |
| Interquartile 25% (IQ1) | $28,657 | $19,410 |
| Interquartile 75% (IQ3) | $36,289 | $42,445 |
| Interquartile Range (IQR) | $7,632 | $23,035 |
| Standard Deviation (Sample) | $4,662 | $13,771 |
| Standard Deviation (Population) | $4,578 | $13,638 |
Demographics Similar to Dutch West Indians and Yup'ik by Median Female Earnings
In terms of median female earnings, the demographic groups most similar to Dutch West Indians are Kiowa ($34,074, a difference of 0.090%), Cajun ($34,034, a difference of 0.21%), Immigrants from Central America ($33,953, a difference of 0.45%), Hopi ($33,932, a difference of 0.51%), and Immigrants from Congo ($34,317, a difference of 0.62%). Similarly, the demographic groups most similar to Yup'ik are Pueblo ($32,564, a difference of 0.51%), Navajo ($33,046, a difference of 0.96%), Tohono O'odham ($33,205, a difference of 1.5%), Immigrants from Mexico ($33,236, a difference of 1.5%), and Immigrants from Cuba ($33,291, a difference of 1.7%).
| Demographics | Rating | Rank | Median Female Earnings |
| Seminole | 0.0 /100 | #323 | Tragic $34,385 |
| Immigrants | Congo | 0.0 /100 | #324 | Tragic $34,317 |
| Dutch West Indians | 0.0 /100 | #325 | Tragic $34,106 |
| Kiowa | 0.0 /100 | #326 | Tragic $34,074 |
| Cajuns | 0.0 /100 | #327 | Tragic $34,034 |
| Immigrants | Central America | 0.0 /100 | #328 | Tragic $33,953 |
| Hopi | 0.0 /100 | #329 | Tragic $33,932 |
| Menominee | 0.0 /100 | #330 | Tragic $33,894 |
| Natives/Alaskans | 0.0 /100 | #331 | Tragic $33,806 |
| Choctaw | 0.0 /100 | #332 | Tragic $33,775 |
| Mexicans | 0.0 /100 | #333 | Tragic $33,664 |
| Spanish American Indians | 0.0 /100 | #334 | Tragic $33,625 |
| Creek | 0.0 /100 | #335 | Tragic $33,437 |
| Ottawa | 0.0 /100 | #336 | Tragic $33,378 |
| Yakama | 0.0 /100 | #337 | Tragic $33,354 |
| Immigrants | Cuba | 0.0 /100 | #338 | Tragic $33,291 |
| Immigrants | Mexico | 0.0 /100 | #339 | Tragic $33,236 |
| Tohono O'odham | 0.0 /100 | #340 | Tragic $33,205 |
| Navajo | 0.0 /100 | #341 | Tragic $33,046 |
| Yup'ik | 0.0 /100 | #342 | Tragic $32,730 |
| Pueblo | 0.0 /100 | #343 | Tragic $32,564 |