Dutch West Indian vs Bhutanese Median Female Earnings
COMPARE
Dutch West Indian
Bhutanese
Median Female Earnings
Median Female Earnings Comparison
Dutch West Indians
Bhutanese
$34,106
MEDIAN FEMALE EARNINGS
0.0/ 100
METRIC RATING
325th/ 347
METRIC RANK
$43,648
MEDIAN FEMALE EARNINGS
100.0/ 100
METRIC RATING
41st/ 347
METRIC RANK
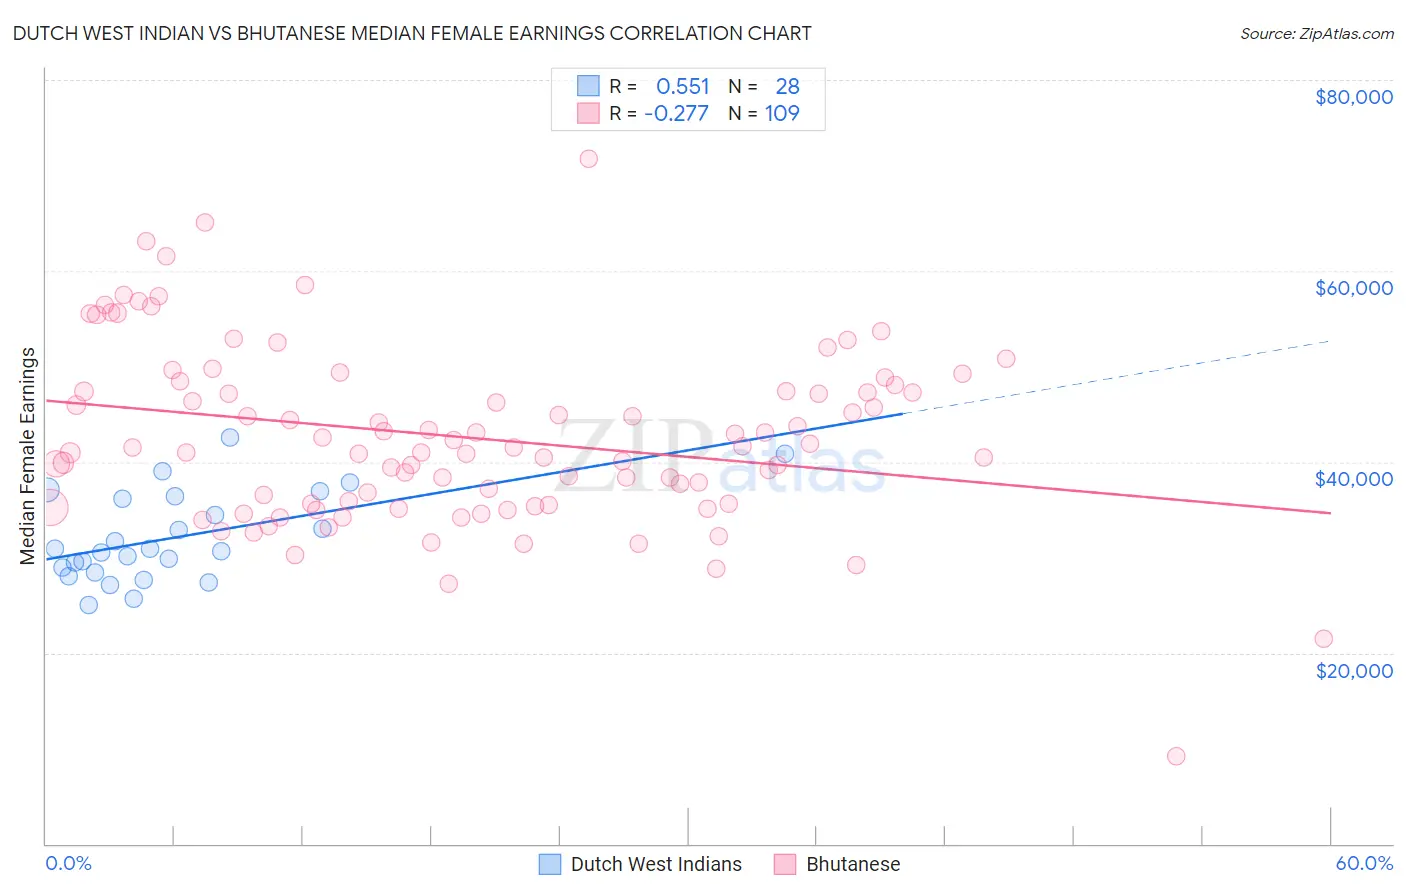
Dutch West Indian vs Bhutanese Median Female Earnings Correlation Chart
The statistical analysis conducted on geographies consisting of 85,733,523 people shows a substantial positive correlation between the proportion of Dutch West Indians and median female earnings in the United States with a correlation coefficient (R) of 0.551 and weighted average of $34,106. Similarly, the statistical analysis conducted on geographies consisting of 455,317,651 people shows a weak negative correlation between the proportion of Bhutanese and median female earnings in the United States with a correlation coefficient (R) of -0.277 and weighted average of $43,648, a difference of 28.0%.
Median Female Earnings Correlation Summary
| Measurement | Dutch West Indian | Bhutanese |
| Minimum | $25,030 | $9,128 |
| Maximum | $42,538 | $71,714 |
| Range | $17,508 | $62,586 |
| Mean | $32,091 | $42,541 |
| Median | $30,746 | $41,499 |
| Interquartile 25% (IQ1) | $28,657 | $35,543 |
| Interquartile 75% (IQ3) | $36,289 | $47,695 |
| Interquartile Range (IQR) | $7,632 | $12,153 |
| Standard Deviation (Sample) | $4,662 | $9,433 |
| Standard Deviation (Population) | $4,578 | $9,390 |
Similar Demographics by Median Female Earnings
Demographics Similar to Dutch West Indians by Median Female Earnings
In terms of median female earnings, the demographic groups most similar to Dutch West Indians are Kiowa ($34,074, a difference of 0.090%), Cajun ($34,034, a difference of 0.21%), Immigrants from Central America ($33,953, a difference of 0.45%), Hopi ($33,932, a difference of 0.51%), and Immigrants from Congo ($34,317, a difference of 0.62%).
| Demographics | Rating | Rank | Median Female Earnings |
| Immigrants | Yemen | 0.0 /100 | #318 | Tragic $34,693 |
| Shoshone | 0.0 /100 | #319 | Tragic $34,677 |
| Immigrants | Honduras | 0.0 /100 | #320 | Tragic $34,647 |
| Hispanics or Latinos | 0.0 /100 | #321 | Tragic $34,421 |
| Chickasaw | 0.0 /100 | #322 | Tragic $34,414 |
| Seminole | 0.0 /100 | #323 | Tragic $34,385 |
| Immigrants | Congo | 0.0 /100 | #324 | Tragic $34,317 |
| Dutch West Indians | 0.0 /100 | #325 | Tragic $34,106 |
| Kiowa | 0.0 /100 | #326 | Tragic $34,074 |
| Cajuns | 0.0 /100 | #327 | Tragic $34,034 |
| Immigrants | Central America | 0.0 /100 | #328 | Tragic $33,953 |
| Hopi | 0.0 /100 | #329 | Tragic $33,932 |
| Menominee | 0.0 /100 | #330 | Tragic $33,894 |
| Natives/Alaskans | 0.0 /100 | #331 | Tragic $33,806 |
| Choctaw | 0.0 /100 | #332 | Tragic $33,775 |
Demographics Similar to Bhutanese by Median Female Earnings
In terms of median female earnings, the demographic groups most similar to Bhutanese are Immigrants from Denmark ($43,646, a difference of 0.0%), Bulgarian ($43,638, a difference of 0.020%), Immigrants from Czechoslovakia ($43,571, a difference of 0.18%), Immigrants from Europe ($43,523, a difference of 0.29%), and Immigrants from Bolivia ($43,467, a difference of 0.42%).
| Demographics | Rating | Rank | Median Female Earnings |
| Russians | 100.0 /100 | #34 | Exceptional $44,169 |
| Immigrants | Sri Lanka | 100.0 /100 | #35 | Exceptional $44,161 |
| Immigrants | Turkey | 100.0 /100 | #36 | Exceptional $44,066 |
| Immigrants | Switzerland | 100.0 /100 | #37 | Exceptional $43,996 |
| Latvians | 100.0 /100 | #38 | Exceptional $43,941 |
| Israelis | 100.0 /100 | #39 | Exceptional $43,852 |
| Immigrants | Malaysia | 100.0 /100 | #40 | Exceptional $43,835 |
| Bhutanese | 100.0 /100 | #41 | Exceptional $43,648 |
| Immigrants | Denmark | 100.0 /100 | #42 | Exceptional $43,646 |
| Bulgarians | 100.0 /100 | #43 | Exceptional $43,638 |
| Immigrants | Czechoslovakia | 100.0 /100 | #44 | Exceptional $43,571 |
| Immigrants | Europe | 100.0 /100 | #45 | Exceptional $43,523 |
| Immigrants | Bolivia | 100.0 /100 | #46 | Exceptional $43,467 |
| Bolivians | 100.0 /100 | #47 | Exceptional $43,445 |
| Immigrants | Indonesia | 100.0 /100 | #48 | Exceptional $43,412 |