Dominican vs Immigrants from England Median Family Income
COMPARE
Dominican
Immigrants from England
Median Family Income
Median Family Income Comparison
Dominicans
Immigrants from England
$82,888
MEDIAN FAMILY INCOME
0.0/ 100
METRIC RATING
322nd/ 347
METRIC RANK
$112,038
MEDIAN FAMILY INCOME
99.2/ 100
METRIC RATING
82nd/ 347
METRIC RANK
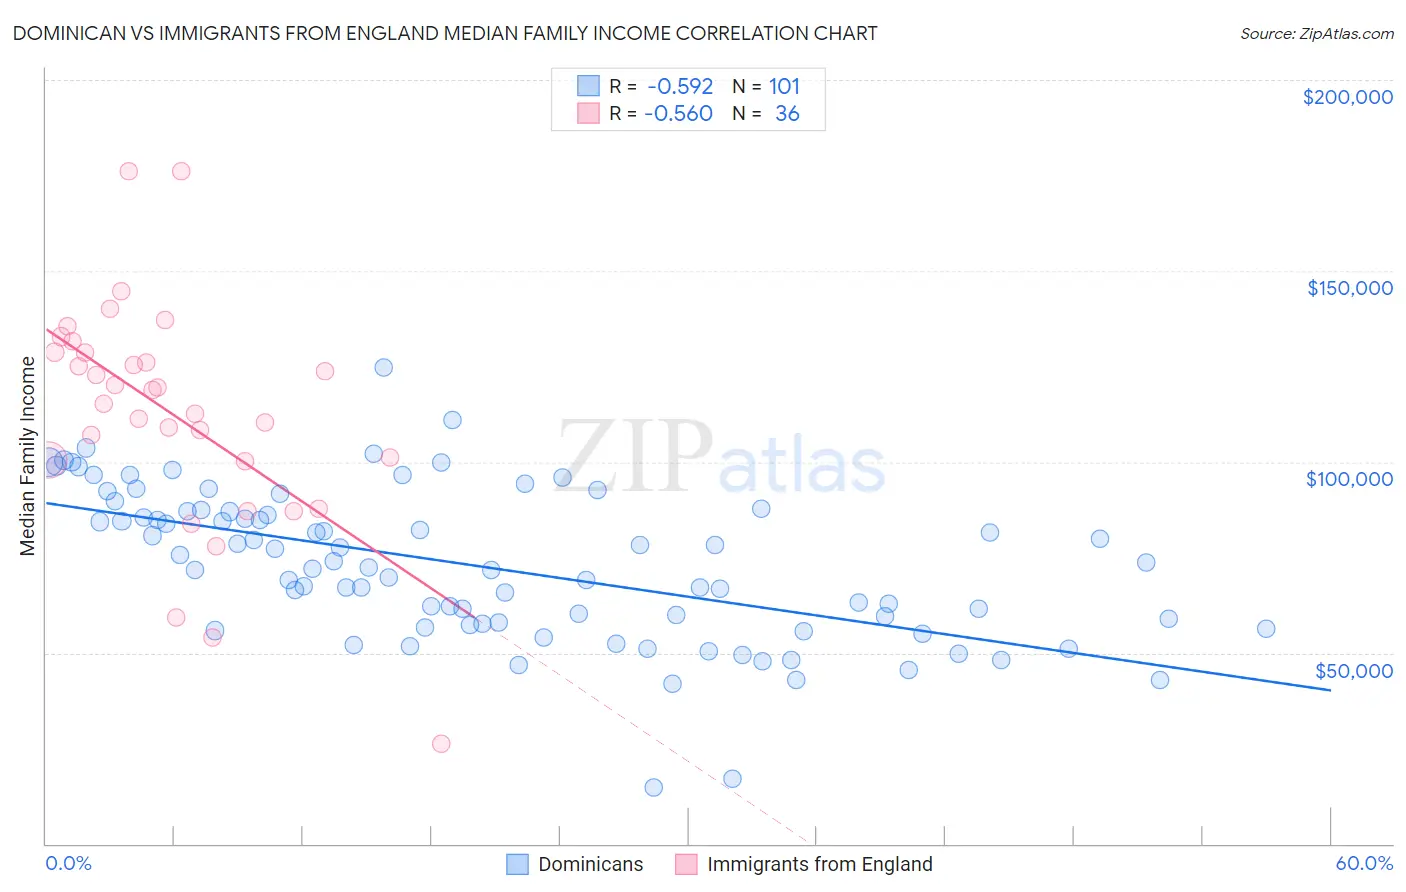
Dominican vs Immigrants from England Median Family Income Correlation Chart
The statistical analysis conducted on geographies consisting of 354,580,571 people shows a substantial negative correlation between the proportion of Dominicans and median family income in the United States with a correlation coefficient (R) of -0.592 and weighted average of $82,888. Similarly, the statistical analysis conducted on geographies consisting of 391,652,266 people shows a substantial negative correlation between the proportion of Immigrants from England and median family income in the United States with a correlation coefficient (R) of -0.560 and weighted average of $112,038, a difference of 35.2%.
Median Family Income Correlation Summary
| Measurement | Dominican | Immigrants from England |
| Minimum | $14,766 | $26,250 |
| Maximum | $124,734 | $176,139 |
| Range | $109,968 | $149,889 |
| Mean | $72,735 | $112,548 |
| Median | $72,364 | $117,120 |
| Interquartile 25% (IQ1) | $57,406 | $100,437 |
| Interquartile 75% (IQ3) | $87,079 | $128,664 |
| Interquartile Range (IQR) | $29,673 | $28,227 |
| Standard Deviation (Sample) | $19,775 | $29,901 |
| Standard Deviation (Population) | $19,677 | $29,483 |
Similar Demographics by Median Family Income
Demographics Similar to Dominicans by Median Family Income
In terms of median family income, the demographic groups most similar to Dominicans are Bahamian ($82,631, a difference of 0.31%), Creek ($82,560, a difference of 0.40%), Immigrants from Caribbean ($83,319, a difference of 0.52%), Seminole ($83,354, a difference of 0.56%), and Sioux ($82,386, a difference of 0.61%).
| Demographics | Rating | Rank | Median Family Income |
| Apache | 0.0 /100 | #315 | Tragic $84,451 |
| Immigrants | Haiti | 0.0 /100 | #316 | Tragic $84,018 |
| Yakama | 0.0 /100 | #317 | Tragic $83,932 |
| Immigrants | Mexico | 0.0 /100 | #318 | Tragic $83,639 |
| Immigrants | Honduras | 0.0 /100 | #319 | Tragic $83,618 |
| Seminole | 0.0 /100 | #320 | Tragic $83,354 |
| Immigrants | Caribbean | 0.0 /100 | #321 | Tragic $83,319 |
| Dominicans | 0.0 /100 | #322 | Tragic $82,888 |
| Bahamians | 0.0 /100 | #323 | Tragic $82,631 |
| Creek | 0.0 /100 | #324 | Tragic $82,560 |
| Sioux | 0.0 /100 | #325 | Tragic $82,386 |
| Immigrants | Congo | 0.0 /100 | #326 | Tragic $82,216 |
| Arapaho | 0.0 /100 | #327 | Tragic $82,064 |
| Blacks/African Americans | 0.0 /100 | #328 | Tragic $81,912 |
| Dutch West Indians | 0.0 /100 | #329 | Tragic $81,852 |
Demographics Similar to Immigrants from England by Median Family Income
In terms of median family income, the demographic groups most similar to Immigrants from England are Immigrants from North America ($112,151, a difference of 0.10%), Immigrants from Croatia ($112,323, a difference of 0.25%), Immigrants from Canada ($112,374, a difference of 0.30%), Italian ($112,372, a difference of 0.30%), and Immigrants from Egypt ($111,689, a difference of 0.31%).
| Demographics | Rating | Rank | Median Family Income |
| Immigrants | Western Europe | 99.4 /100 | #75 | Exceptional $112,688 |
| Argentineans | 99.4 /100 | #76 | Exceptional $112,665 |
| Immigrants | Eastern Europe | 99.4 /100 | #77 | Exceptional $112,527 |
| Immigrants | Canada | 99.3 /100 | #78 | Exceptional $112,374 |
| Italians | 99.3 /100 | #79 | Exceptional $112,372 |
| Immigrants | Croatia | 99.3 /100 | #80 | Exceptional $112,323 |
| Immigrants | North America | 99.2 /100 | #81 | Exceptional $112,151 |
| Immigrants | England | 99.2 /100 | #82 | Exceptional $112,038 |
| Immigrants | Egypt | 99.0 /100 | #83 | Exceptional $111,689 |
| Immigrants | Hungary | 98.8 /100 | #84 | Exceptional $111,378 |
| Croatians | 98.8 /100 | #85 | Exceptional $111,370 |
| Ukrainians | 98.8 /100 | #86 | Exceptional $111,368 |
| Austrians | 98.8 /100 | #87 | Exceptional $111,306 |
| Romanians | 98.8 /100 | #88 | Exceptional $111,243 |
| Immigrants | Argentina | 98.5 /100 | #89 | Exceptional $110,873 |