Dominican vs Immigrants from Iraq Median Family Income
COMPARE
Dominican
Immigrants from Iraq
Median Family Income
Median Family Income Comparison
Dominicans
Immigrants from Iraq
$82,888
MEDIAN FAMILY INCOME
0.0/ 100
METRIC RATING
322nd/ 347
METRIC RANK
$98,786
MEDIAN FAMILY INCOME
12.1/ 100
METRIC RATING
206th/ 347
METRIC RANK
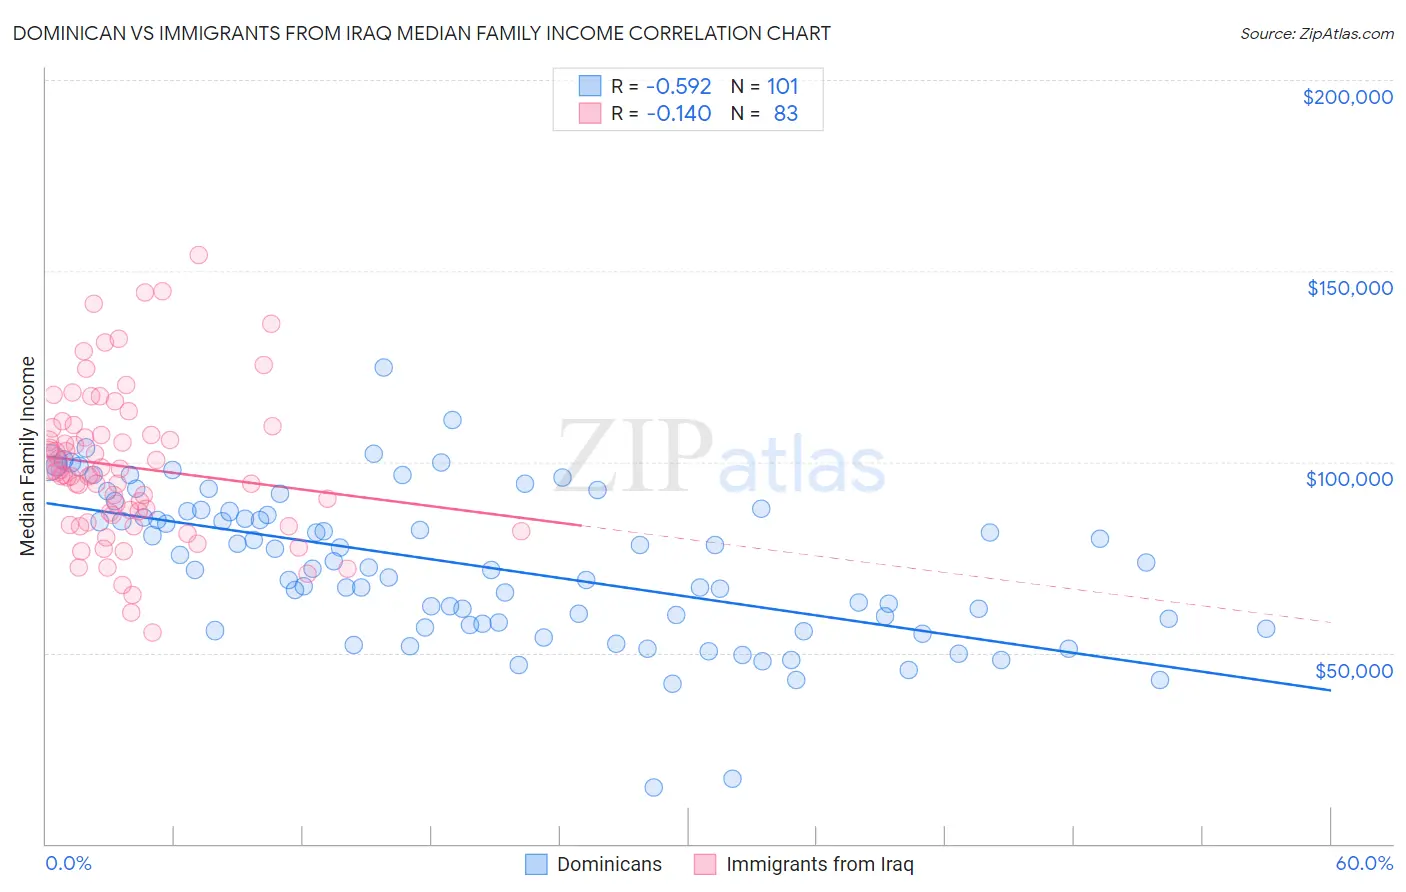
Dominican vs Immigrants from Iraq Median Family Income Correlation Chart
The statistical analysis conducted on geographies consisting of 354,580,571 people shows a substantial negative correlation between the proportion of Dominicans and median family income in the United States with a correlation coefficient (R) of -0.592 and weighted average of $82,888. Similarly, the statistical analysis conducted on geographies consisting of 194,718,610 people shows a poor negative correlation between the proportion of Immigrants from Iraq and median family income in the United States with a correlation coefficient (R) of -0.140 and weighted average of $98,786, a difference of 19.2%.
Median Family Income Correlation Summary
| Measurement | Dominican | Immigrants from Iraq |
| Minimum | $14,766 | $55,430 |
| Maximum | $124,734 | $154,107 |
| Range | $109,968 | $98,677 |
| Mean | $72,735 | $98,657 |
| Median | $72,364 | $96,637 |
| Interquartile 25% (IQ1) | $57,406 | $83,994 |
| Interquartile 75% (IQ3) | $87,079 | $108,953 |
| Interquartile Range (IQR) | $29,673 | $24,960 |
| Standard Deviation (Sample) | $19,775 | $19,813 |
| Standard Deviation (Population) | $19,677 | $19,693 |
Similar Demographics by Median Family Income
Demographics Similar to Dominicans by Median Family Income
In terms of median family income, the demographic groups most similar to Dominicans are Bahamian ($82,631, a difference of 0.31%), Creek ($82,560, a difference of 0.40%), Immigrants from Caribbean ($83,319, a difference of 0.52%), Seminole ($83,354, a difference of 0.56%), and Sioux ($82,386, a difference of 0.61%).
| Demographics | Rating | Rank | Median Family Income |
| Apache | 0.0 /100 | #315 | Tragic $84,451 |
| Immigrants | Haiti | 0.0 /100 | #316 | Tragic $84,018 |
| Yakama | 0.0 /100 | #317 | Tragic $83,932 |
| Immigrants | Mexico | 0.0 /100 | #318 | Tragic $83,639 |
| Immigrants | Honduras | 0.0 /100 | #319 | Tragic $83,618 |
| Seminole | 0.0 /100 | #320 | Tragic $83,354 |
| Immigrants | Caribbean | 0.0 /100 | #321 | Tragic $83,319 |
| Dominicans | 0.0 /100 | #322 | Tragic $82,888 |
| Bahamians | 0.0 /100 | #323 | Tragic $82,631 |
| Creek | 0.0 /100 | #324 | Tragic $82,560 |
| Sioux | 0.0 /100 | #325 | Tragic $82,386 |
| Immigrants | Congo | 0.0 /100 | #326 | Tragic $82,216 |
| Arapaho | 0.0 /100 | #327 | Tragic $82,064 |
| Blacks/African Americans | 0.0 /100 | #328 | Tragic $81,912 |
| Dutch West Indians | 0.0 /100 | #329 | Tragic $81,852 |
Demographics Similar to Immigrants from Iraq by Median Family Income
In terms of median family income, the demographic groups most similar to Immigrants from Iraq are Hawaiian ($98,869, a difference of 0.080%), Aleut ($98,702, a difference of 0.080%), Ghanaian ($98,877, a difference of 0.090%), Immigrants from Uruguay ($98,205, a difference of 0.59%), and Immigrants from Colombia ($98,067, a difference of 0.73%).
| Demographics | Rating | Rank | Median Family Income |
| Yugoslavians | 21.3 /100 | #199 | Fair $100,119 |
| Spanish | 20.1 /100 | #200 | Fair $99,977 |
| Immigrants | Thailand | 19.0 /100 | #201 | Poor $99,840 |
| Whites/Caucasians | 18.7 /100 | #202 | Poor $99,800 |
| Scotch-Irish | 17.1 /100 | #203 | Poor $99,591 |
| Ghanaians | 12.6 /100 | #204 | Poor $98,877 |
| Hawaiians | 12.5 /100 | #205 | Poor $98,869 |
| Immigrants | Iraq | 12.1 /100 | #206 | Poor $98,786 |
| Aleuts | 11.6 /100 | #207 | Poor $98,702 |
| Immigrants | Uruguay | 9.2 /100 | #208 | Tragic $98,205 |
| Immigrants | Colombia | 8.7 /100 | #209 | Tragic $98,067 |
| Puget Sound Salish | 8.2 /100 | #210 | Tragic $97,958 |
| Immigrants | Sudan | 7.4 /100 | #211 | Tragic $97,737 |
| Panamanians | 7.2 /100 | #212 | Tragic $97,683 |
| Immigrants | Armenia | 7.0 /100 | #213 | Tragic $97,605 |