Dominican vs Spanish American Indian Currently Married
COMPARE
Dominican
Spanish American Indian
Currently Married
Currently Married Comparison
Dominicans
Spanish American Indians
39.5%
CURRENTLY MARRIED
0.0/ 100
METRIC RATING
339th/ 347
METRIC RANK
43.6%
CURRENTLY MARRIED
0.1/ 100
METRIC RATING
268th/ 347
METRIC RANK
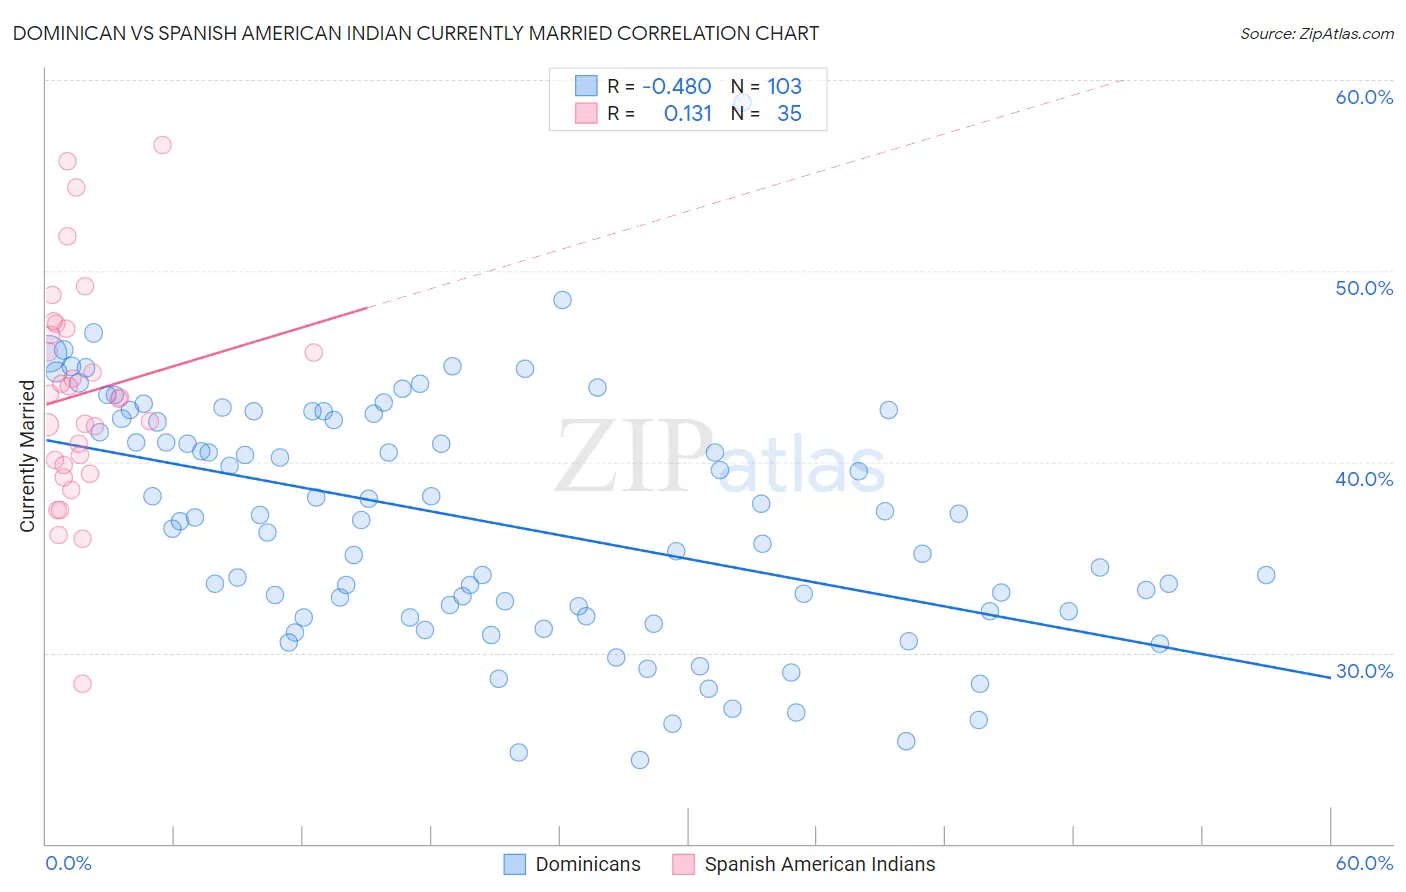
Dominican vs Spanish American Indian Currently Married Correlation Chart
The statistical analysis conducted on geographies consisting of 355,078,950 people shows a moderate negative correlation between the proportion of Dominicans and percentage of population currently married in the United States with a correlation coefficient (R) of -0.480 and weighted average of 39.5%. Similarly, the statistical analysis conducted on geographies consisting of 73,150,359 people shows a poor positive correlation between the proportion of Spanish American Indians and percentage of population currently married in the United States with a correlation coefficient (R) of 0.131 and weighted average of 43.6%, a difference of 10.3%.
Currently Married Correlation Summary
| Measurement | Dominican | Spanish American Indian |
| Minimum | 24.4% | 28.4% |
| Maximum | 58.8% | 56.6% |
| Range | 34.4% | 28.2% |
| Mean | 36.9% | 43.6% |
| Median | 37.0% | 43.4% |
| Interquartile 25% (IQ1) | 32.2% | 39.8% |
| Interquartile 75% (IQ3) | 42.3% | 47.0% |
| Interquartile Range (IQR) | 10.1% | 7.2% |
| Standard Deviation (Sample) | 6.3% | 5.8% |
| Standard Deviation (Population) | 6.2% | 5.7% |
Similar Demographics by Currently Married
Demographics Similar to Dominicans by Currently Married
In terms of currently married, the demographic groups most similar to Dominicans are Cape Verdean (39.6%, a difference of 0.15%), Black/African American (39.6%, a difference of 0.25%), British West Indian (39.8%, a difference of 0.63%), Lumbee (39.8%, a difference of 0.80%), and Immigrants from Grenada (39.1%, a difference of 0.96%).
| Demographics | Rating | Rank | Currently Married |
| Immigrants | St. Vincent and the Grenadines | 0.0 /100 | #332 | Tragic 40.1% |
| Yup'ik | 0.0 /100 | #333 | Tragic 39.9% |
| Puerto Ricans | 0.0 /100 | #334 | Tragic 39.9% |
| Lumbee | 0.0 /100 | #335 | Tragic 39.8% |
| British West Indians | 0.0 /100 | #336 | Tragic 39.8% |
| Blacks/African Americans | 0.0 /100 | #337 | Tragic 39.6% |
| Cape Verdeans | 0.0 /100 | #338 | Tragic 39.6% |
| Dominicans | 0.0 /100 | #339 | Tragic 39.5% |
| Immigrants | Grenada | 0.0 /100 | #340 | Tragic 39.1% |
| Navajo | 0.0 /100 | #341 | Tragic 39.0% |
| Immigrants | Dominican Republic | 0.0 /100 | #342 | Tragic 38.9% |
| Pueblo | 0.0 /100 | #343 | Tragic 38.2% |
| Immigrants | Cabo Verde | 0.0 /100 | #344 | Tragic 37.8% |
| Tohono O'odham | 0.0 /100 | #345 | Tragic 36.8% |
| Hopi | 0.0 /100 | #346 | Tragic 36.5% |
Demographics Similar to Spanish American Indians by Currently Married
In terms of currently married, the demographic groups most similar to Spanish American Indians are Immigrants from Eritrea (43.6%, a difference of 0.0%), Ecuadorian (43.6%, a difference of 0.030%), Immigrants from Bangladesh (43.6%, a difference of 0.10%), Immigrants from Sudan (43.5%, a difference of 0.12%), and Sudanese (43.7%, a difference of 0.18%).
| Demographics | Rating | Rank | Currently Married |
| Immigrants | Nicaragua | 0.1 /100 | #261 | Tragic 43.7% |
| Bangladeshis | 0.1 /100 | #262 | Tragic 43.7% |
| Immigrants | Cuba | 0.1 /100 | #263 | Tragic 43.7% |
| Sudanese | 0.1 /100 | #264 | Tragic 43.7% |
| Immigrants | Bangladesh | 0.1 /100 | #265 | Tragic 43.6% |
| Ecuadorians | 0.1 /100 | #266 | Tragic 43.6% |
| Immigrants | Eritrea | 0.1 /100 | #267 | Tragic 43.6% |
| Spanish American Indians | 0.1 /100 | #268 | Tragic 43.6% |
| Immigrants | Sudan | 0.1 /100 | #269 | Tragic 43.5% |
| Salvadorans | 0.1 /100 | #270 | Tragic 43.5% |
| Bermudans | 0.1 /100 | #271 | Tragic 43.5% |
| Indonesians | 0.1 /100 | #272 | Tragic 43.5% |
| Yaqui | 0.1 /100 | #273 | Tragic 43.4% |
| Nigerians | 0.1 /100 | #274 | Tragic 43.4% |
| Colville | 0.1 /100 | #275 | Tragic 43.4% |