Dominican vs Yuman Median Family Income
COMPARE
Dominican
Yuman
Median Family Income
Median Family Income Comparison
Dominicans
Yuman
$82,888
MEDIAN FAMILY INCOME
0.0/ 100
METRIC RATING
322nd/ 347
METRIC RANK
$78,055
MEDIAN FAMILY INCOME
0.0/ 100
METRIC RATING
337th/ 347
METRIC RANK
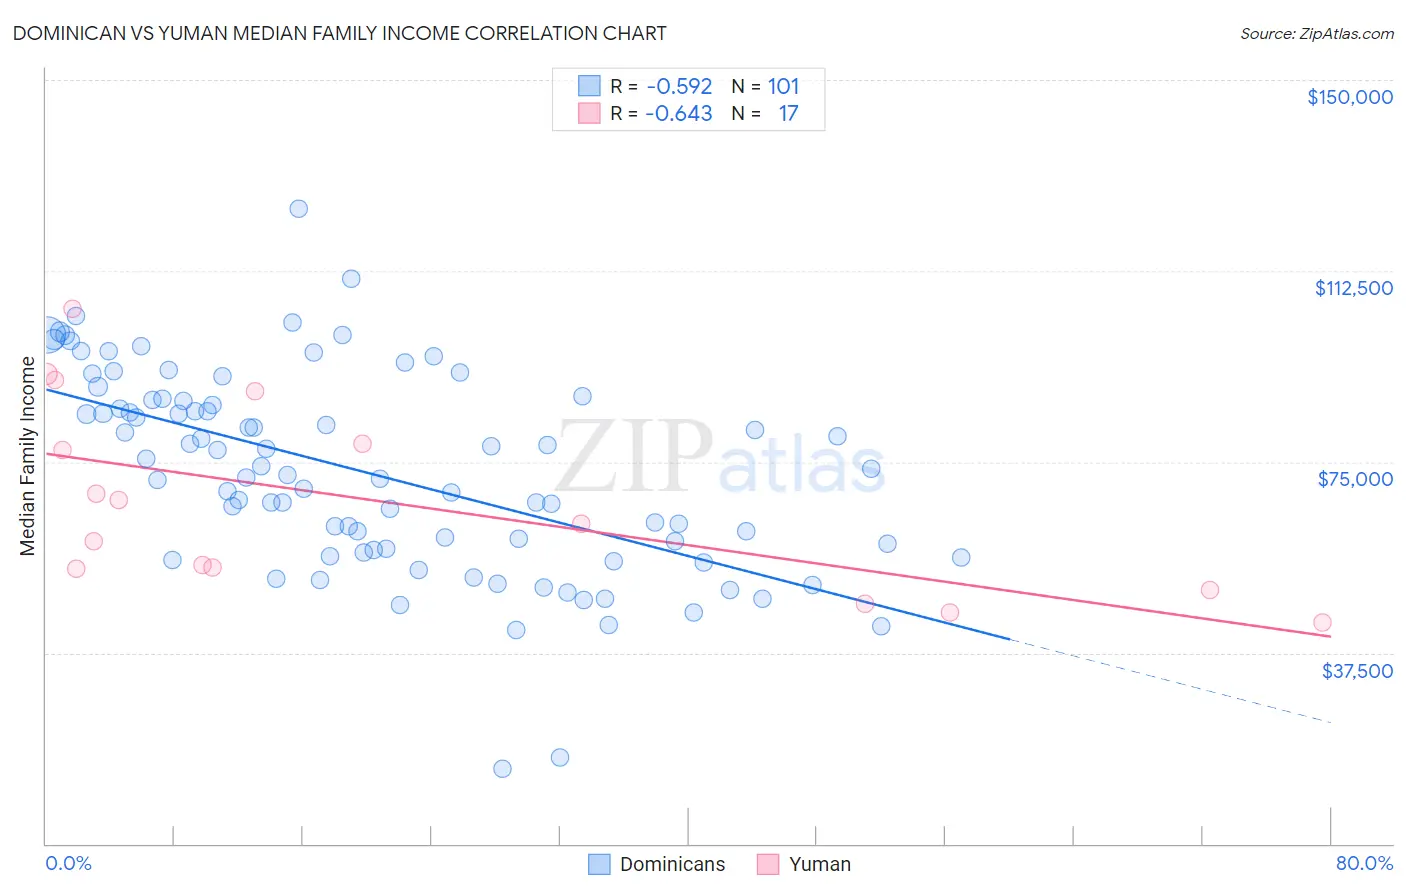
Dominican vs Yuman Median Family Income Correlation Chart
The statistical analysis conducted on geographies consisting of 354,580,571 people shows a substantial negative correlation between the proportion of Dominicans and median family income in the United States with a correlation coefficient (R) of -0.592 and weighted average of $82,888. Similarly, the statistical analysis conducted on geographies consisting of 40,661,885 people shows a significant negative correlation between the proportion of Yuman and median family income in the United States with a correlation coefficient (R) of -0.643 and weighted average of $78,055, a difference of 6.2%.
Median Family Income Correlation Summary
| Measurement | Dominican | Yuman |
| Minimum | $14,766 | $43,500 |
| Maximum | $124,734 | $104,959 |
| Range | $109,968 | $61,459 |
| Mean | $72,735 | $67,052 |
| Median | $72,364 | $62,813 |
| Interquartile 25% (IQ1) | $57,406 | $51,959 |
| Interquartile 75% (IQ3) | $87,079 | $83,716 |
| Interquartile Range (IQR) | $29,673 | $31,757 |
| Standard Deviation (Sample) | $19,775 | $18,787 |
| Standard Deviation (Population) | $19,677 | $18,226 |
Demographics Similar to Dominicans and Yuman by Median Family Income
In terms of median family income, the demographic groups most similar to Dominicans are Bahamian ($82,631, a difference of 0.31%), Creek ($82,560, a difference of 0.40%), Immigrants from Caribbean ($83,319, a difference of 0.52%), Seminole ($83,354, a difference of 0.56%), and Sioux ($82,386, a difference of 0.61%). Similarly, the demographic groups most similar to Yuman are Immigrants from Cuba ($78,249, a difference of 0.25%), Immigrants from Yemen ($77,457, a difference of 0.77%), Pima ($77,431, a difference of 0.80%), Yup'ik ($79,290, a difference of 1.6%), and Menominee ($79,563, a difference of 1.9%).
| Demographics | Rating | Rank | Median Family Income |
| Immigrants | Honduras | 0.0 /100 | #319 | Tragic $83,618 |
| Seminole | 0.0 /100 | #320 | Tragic $83,354 |
| Immigrants | Caribbean | 0.0 /100 | #321 | Tragic $83,319 |
| Dominicans | 0.0 /100 | #322 | Tragic $82,888 |
| Bahamians | 0.0 /100 | #323 | Tragic $82,631 |
| Creek | 0.0 /100 | #324 | Tragic $82,560 |
| Sioux | 0.0 /100 | #325 | Tragic $82,386 |
| Immigrants | Congo | 0.0 /100 | #326 | Tragic $82,216 |
| Arapaho | 0.0 /100 | #327 | Tragic $82,064 |
| Blacks/African Americans | 0.0 /100 | #328 | Tragic $81,912 |
| Dutch West Indians | 0.0 /100 | #329 | Tragic $81,852 |
| Cheyenne | 0.0 /100 | #330 | Tragic $81,385 |
| Immigrants | Dominican Republic | 0.0 /100 | #331 | Tragic $81,233 |
| Natives/Alaskans | 0.0 /100 | #332 | Tragic $80,908 |
| Kiowa | 0.0 /100 | #333 | Tragic $80,885 |
| Menominee | 0.0 /100 | #334 | Tragic $79,563 |
| Yup'ik | 0.0 /100 | #335 | Tragic $79,290 |
| Immigrants | Cuba | 0.0 /100 | #336 | Tragic $78,249 |
| Yuman | 0.0 /100 | #337 | Tragic $78,055 |
| Immigrants | Yemen | 0.0 /100 | #338 | Tragic $77,457 |
| Pima | 0.0 /100 | #339 | Tragic $77,431 |