Dominican vs Immigrants from Taiwan No Schooling Completed
COMPARE
Dominican
Immigrants from Taiwan
No Schooling Completed
No Schooling Completed Comparison
Dominicans
Immigrants from Taiwan
3.2%
NO SCHOOLING COMPLETED
0.0/ 100
METRIC RATING
325th/ 347
METRIC RANK
2.1%
NO SCHOOLING COMPLETED
42.6/ 100
METRIC RATING
181st/ 347
METRIC RANK
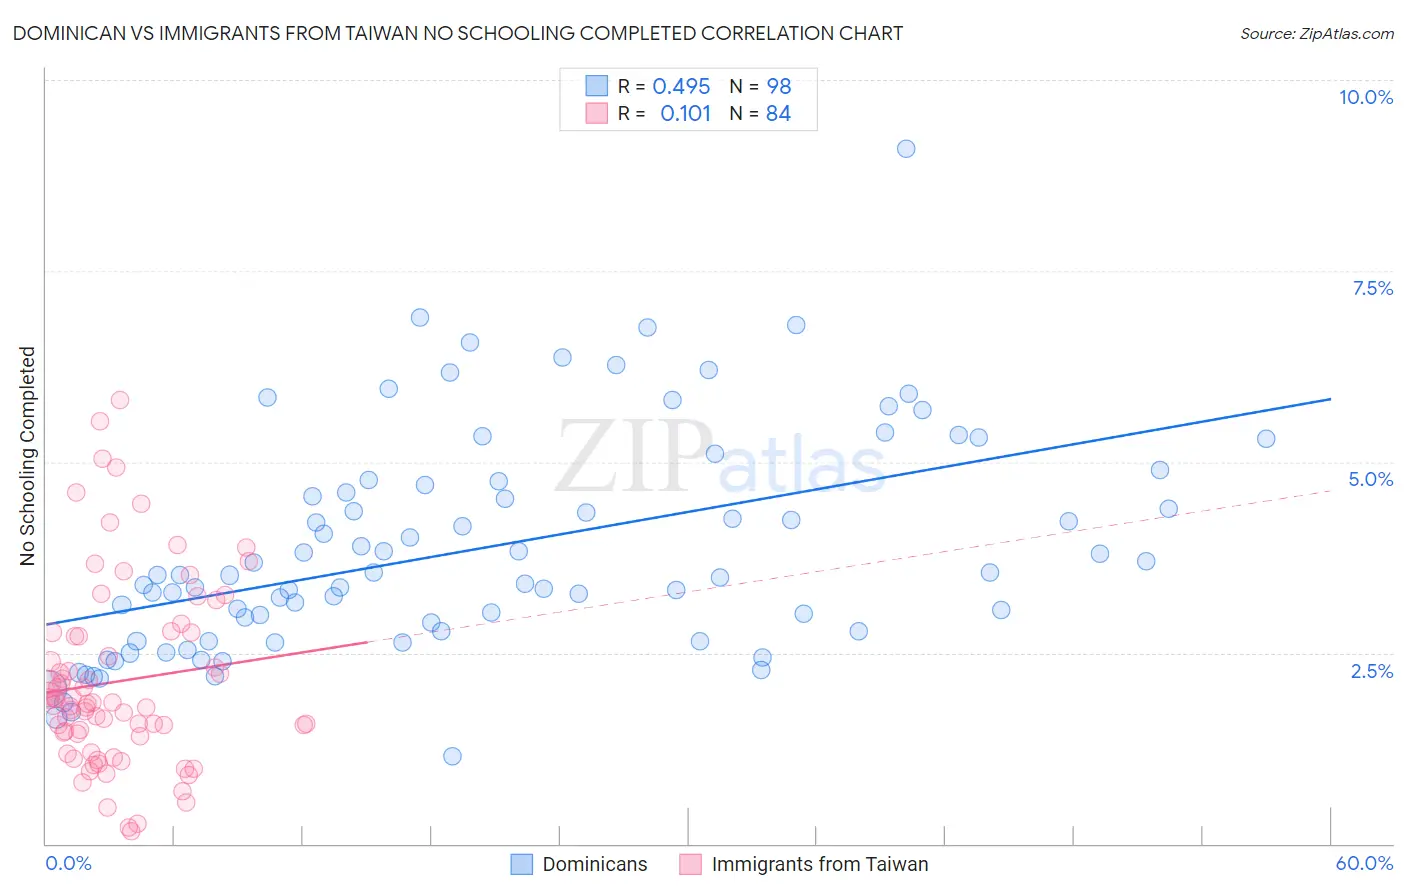
Dominican vs Immigrants from Taiwan No Schooling Completed Correlation Chart
The statistical analysis conducted on geographies consisting of 352,198,650 people shows a moderate positive correlation between the proportion of Dominicans and percentage of population with no schooling in the United States with a correlation coefficient (R) of 0.495 and weighted average of 3.2%. Similarly, the statistical analysis conducted on geographies consisting of 295,749,298 people shows a poor positive correlation between the proportion of Immigrants from Taiwan and percentage of population with no schooling in the United States with a correlation coefficient (R) of 0.101 and weighted average of 2.1%, a difference of 51.9%.
No Schooling Completed Correlation Summary
| Measurement | Dominican | Immigrants from Taiwan |
| Minimum | 1.2% | 0.16% |
| Maximum | 9.1% | 5.8% |
| Range | 8.0% | 5.7% |
| Mean | 3.9% | 2.1% |
| Median | 3.5% | 1.8% |
| Interquartile 25% (IQ1) | 2.8% | 1.4% |
| Interquartile 75% (IQ3) | 4.7% | 2.7% |
| Interquartile Range (IQR) | 1.9% | 1.3% |
| Standard Deviation (Sample) | 1.4% | 1.2% |
| Standard Deviation (Population) | 1.4% | 1.2% |
Similar Demographics by No Schooling Completed
Demographics Similar to Dominicans by No Schooling Completed
In terms of no schooling completed, the demographic groups most similar to Dominicans are Indonesian (3.2%, a difference of 0.030%), Mexican American Indian (3.2%, a difference of 0.67%), Vietnamese (3.2%, a difference of 1.0%), Immigrants from Honduras (3.2%, a difference of 1.2%), and Immigrants from Laos (3.1%, a difference of 1.9%).
| Demographics | Rating | Rank | No Schooling Completed |
| Immigrants | Guyana | 0.0 /100 | #318 | Tragic 3.1% |
| Immigrants | Burma/Myanmar | 0.0 /100 | #319 | Tragic 3.1% |
| Immigrants | Bangladesh | 0.0 /100 | #320 | Tragic 3.1% |
| Immigrants | Laos | 0.0 /100 | #321 | Tragic 3.1% |
| Immigrants | Honduras | 0.0 /100 | #322 | Tragic 3.2% |
| Vietnamese | 0.0 /100 | #323 | Tragic 3.2% |
| Mexican American Indians | 0.0 /100 | #324 | Tragic 3.2% |
| Dominicans | 0.0 /100 | #325 | Tragic 3.2% |
| Indonesians | 0.0 /100 | #326 | Tragic 3.2% |
| Immigrants | Latin America | 0.0 /100 | #327 | Tragic 3.3% |
| Mexicans | 0.0 /100 | #328 | Tragic 3.3% |
| Immigrants | Vietnam | 0.0 /100 | #329 | Tragic 3.3% |
| Immigrants | Armenia | 0.0 /100 | #330 | Tragic 3.3% |
| Japanese | 0.0 /100 | #331 | Tragic 3.3% |
| Central Americans | 0.0 /100 | #332 | Tragic 3.4% |
Demographics Similar to Immigrants from Taiwan by No Schooling Completed
In terms of no schooling completed, the demographic groups most similar to Immigrants from Taiwan are French American Indian (2.1%, a difference of 0.050%), Black/African American (2.1%, a difference of 0.15%), Pima (2.1%, a difference of 0.17%), Portuguese (2.1%, a difference of 0.18%), and Immigrants from Kazakhstan (2.1%, a difference of 0.24%).
| Demographics | Rating | Rank | No Schooling Completed |
| Immigrants | Micronesia | 50.0 /100 | #174 | Average 2.1% |
| Arabs | 46.4 /100 | #175 | Average 2.1% |
| Panamanians | 45.2 /100 | #176 | Average 2.1% |
| Arapaho | 45.0 /100 | #177 | Average 2.1% |
| Pakistanis | 44.7 /100 | #178 | Average 2.1% |
| Immigrants | Kazakhstan | 44.3 /100 | #179 | Average 2.1% |
| Portuguese | 43.9 /100 | #180 | Average 2.1% |
| Immigrants | Taiwan | 42.6 /100 | #181 | Average 2.1% |
| French American Indians | 42.2 /100 | #182 | Average 2.1% |
| Blacks/African Americans | 41.4 /100 | #183 | Average 2.1% |
| Pima | 41.3 /100 | #184 | Average 2.1% |
| Mongolians | 40.8 /100 | #185 | Average 2.1% |
| Immigrants | Bosnia and Herzegovina | 38.6 /100 | #186 | Fair 2.1% |
| Navajo | 36.5 /100 | #187 | Fair 2.1% |
| Immigrants | Kenya | 36.2 /100 | #188 | Fair 2.1% |