Dominican vs Basque Wage/Income Gap
COMPARE
Dominican
Basque
Wage/Income Gap
Wage/Income Gap Comparison
Dominicans
Basques
20.6%
WAGE/INCOME GAP
100.0/ 100
METRIC RATING
24th/ 347
METRIC RANK
28.8%
WAGE/INCOME GAP
0.1/ 100
METRIC RATING
318th/ 347
METRIC RANK
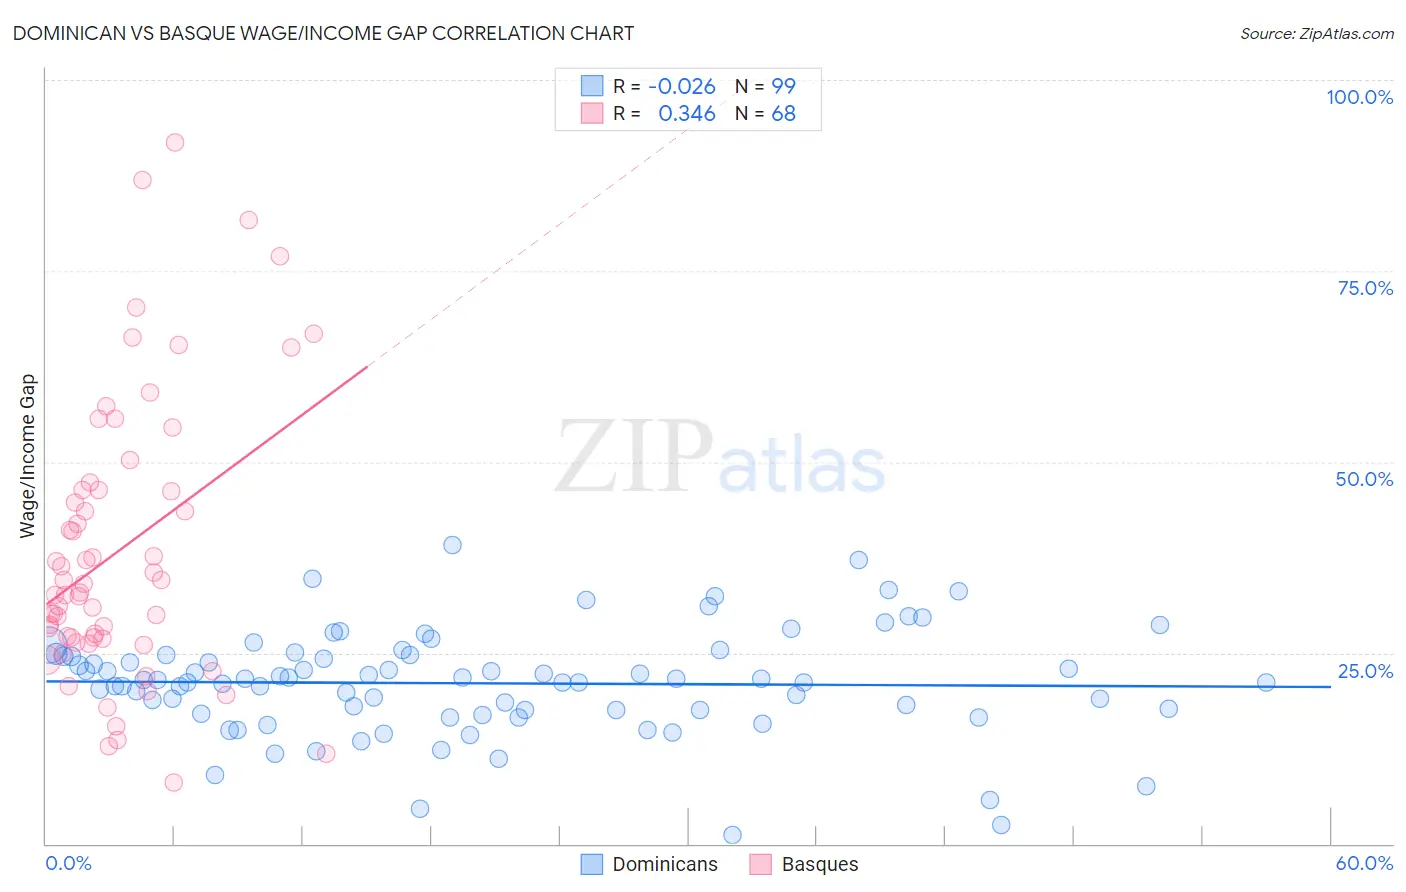
Dominican vs Basque Wage/Income Gap Correlation Chart
The statistical analysis conducted on geographies consisting of 354,862,114 people shows no correlation between the proportion of Dominicans and wage/income gap percentage in the United States with a correlation coefficient (R) of -0.026 and weighted average of 20.6%. Similarly, the statistical analysis conducted on geographies consisting of 165,712,843 people shows a mild positive correlation between the proportion of Basques and wage/income gap percentage in the United States with a correlation coefficient (R) of 0.346 and weighted average of 28.8%, a difference of 39.8%.
Wage/Income Gap Correlation Summary
| Measurement | Dominican | Basque |
| Minimum | 1.2% | 8.0% |
| Maximum | 39.2% | 91.8% |
| Range | 37.9% | 83.8% |
| Mean | 21.0% | 38.5% |
| Median | 21.4% | 33.4% |
| Interquartile 25% (IQ1) | 17.5% | 26.9% |
| Interquartile 75% (IQ3) | 24.7% | 46.3% |
| Interquartile Range (IQR) | 7.2% | 19.3% |
| Standard Deviation (Sample) | 6.9% | 18.3% |
| Standard Deviation (Population) | 6.8% | 18.2% |
Similar Demographics by Wage/Income Gap
Demographics Similar to Dominicans by Wage/Income Gap
In terms of wage/income gap, the demographic groups most similar to Dominicans are Immigrants from Dominican Republic (20.6%, a difference of 0.17%), Immigrants from Liberia (20.6%, a difference of 0.19%), Senegalese (20.7%, a difference of 0.30%), Pueblo (20.7%, a difference of 0.41%), and Immigrants from Armenia (20.7%, a difference of 0.62%).
| Demographics | Rating | Rank | Wage/Income Gap |
| Haitians | 100.0 /100 | #17 | Exceptional 19.7% |
| Hopi | 100.0 /100 | #18 | Exceptional 20.0% |
| Immigrants | Dominica | 100.0 /100 | #19 | Exceptional 20.0% |
| Bahamians | 100.0 /100 | #20 | Exceptional 20.2% |
| Immigrants | Caribbean | 100.0 /100 | #21 | Exceptional 20.4% |
| Immigrants | Liberia | 100.0 /100 | #22 | Exceptional 20.6% |
| Immigrants | Dominican Republic | 100.0 /100 | #23 | Exceptional 20.6% |
| Dominicans | 100.0 /100 | #24 | Exceptional 20.6% |
| Senegalese | 100.0 /100 | #25 | Exceptional 20.7% |
| Pueblo | 100.0 /100 | #26 | Exceptional 20.7% |
| Immigrants | Armenia | 100.0 /100 | #27 | Exceptional 20.7% |
| Inupiat | 100.0 /100 | #28 | Exceptional 20.8% |
| Immigrants | Senegal | 100.0 /100 | #29 | Exceptional 20.9% |
| Immigrants | Bangladesh | 100.0 /100 | #30 | Exceptional 20.9% |
| Vietnamese | 100.0 /100 | #31 | Exceptional 21.0% |
Demographics Similar to Basques by Wage/Income Gap
In terms of wage/income gap, the demographic groups most similar to Basques are Belgian (28.8%, a difference of 0.050%), Lithuanian (28.7%, a difference of 0.16%), Maltese (28.7%, a difference of 0.17%), Immigrants from Scotland (28.7%, a difference of 0.22%), and Slovak (28.9%, a difference of 0.31%).
| Demographics | Rating | Rank | Wage/Income Gap |
| Immigrants | Lithuania | 0.1 /100 | #311 | Tragic 28.6% |
| Eastern Europeans | 0.1 /100 | #312 | Tragic 28.6% |
| French | 0.1 /100 | #313 | Tragic 28.7% |
| Immigrants | Scotland | 0.1 /100 | #314 | Tragic 28.7% |
| Maltese | 0.1 /100 | #315 | Tragic 28.7% |
| Lithuanians | 0.1 /100 | #316 | Tragic 28.7% |
| Belgians | 0.1 /100 | #317 | Tragic 28.8% |
| Basques | 0.1 /100 | #318 | Tragic 28.8% |
| Slovaks | 0.1 /100 | #319 | Tragic 28.9% |
| British | 0.1 /100 | #320 | Tragic 28.9% |
| Welsh | 0.1 /100 | #321 | Tragic 28.9% |
| Immigrants | Singapore | 0.1 /100 | #322 | Tragic 28.9% |
| Norwegians | 0.1 /100 | #323 | Tragic 29.0% |
| Croatians | 0.0 /100 | #324 | Tragic 29.0% |
| Hungarians | 0.0 /100 | #325 | Tragic 29.0% |