Danish vs Yakama Median Earnings
COMPARE
Danish
Yakama
Median Earnings
Median Earnings Comparison
Danes
Yakama
$46,392
MEDIAN EARNINGS
48.6/ 100
METRIC RATING
176th/ 347
METRIC RANK
$39,107
MEDIAN EARNINGS
0.0/ 100
METRIC RATING
332nd/ 347
METRIC RANK
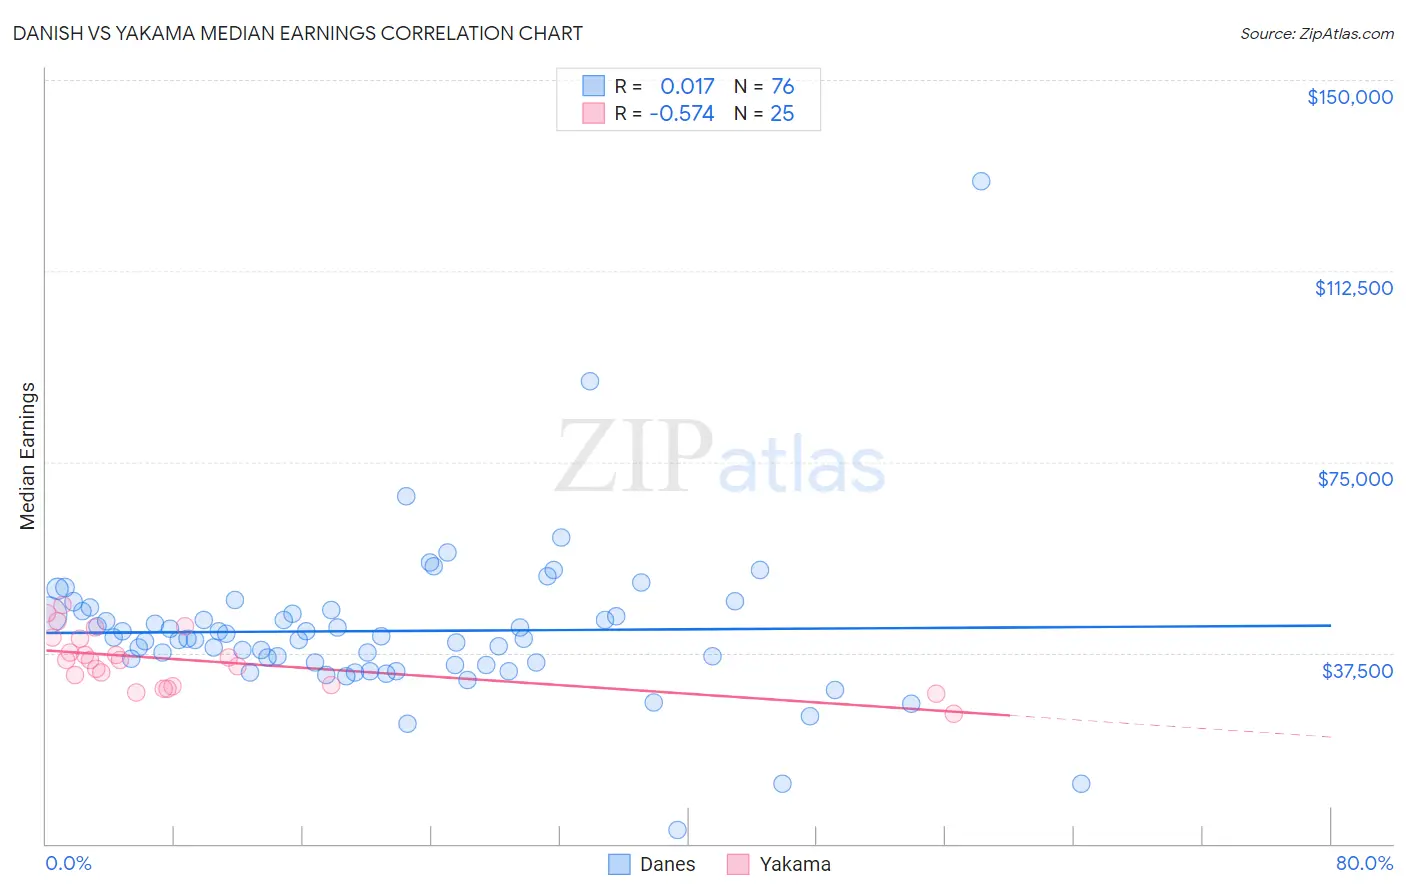
Danish vs Yakama Median Earnings Correlation Chart
The statistical analysis conducted on geographies consisting of 474,068,327 people shows no correlation between the proportion of Danes and median earnings in the United States with a correlation coefficient (R) of 0.017 and weighted average of $46,392. Similarly, the statistical analysis conducted on geographies consisting of 19,920,783 people shows a substantial negative correlation between the proportion of Yakama and median earnings in the United States with a correlation coefficient (R) of -0.574 and weighted average of $39,107, a difference of 18.6%.
Median Earnings Correlation Summary
| Measurement | Danish | Yakama |
| Minimum | $2,766 | $25,625 |
| Maximum | $130,117 | $46,951 |
| Range | $127,351 | $21,326 |
| Mean | $41,795 | $36,082 |
| Median | $40,260 | $36,058 |
| Interquartile 25% (IQ1) | $35,372 | $30,946 |
| Interquartile 75% (IQ3) | $45,489 | $40,418 |
| Interquartile Range (IQR) | $10,117 | $9,471 |
| Standard Deviation (Sample) | $15,565 | $5,481 |
| Standard Deviation (Population) | $15,462 | $5,370 |
Similar Demographics by Median Earnings
Demographics Similar to Danes by Median Earnings
In terms of median earnings, the demographic groups most similar to Danes are Basque ($46,399, a difference of 0.020%), Belgian ($46,375, a difference of 0.040%), Scandinavian ($46,433, a difference of 0.090%), Colombian ($46,349, a difference of 0.090%), and Ghanaian ($46,440, a difference of 0.10%).
| Demographics | Rating | Rank | Median Earnings |
| Immigrants | South America | 54.0 /100 | #169 | Average $46,548 |
| Immigrants | Immigrants | 51.6 /100 | #170 | Average $46,478 |
| Scottish | 51.1 /100 | #171 | Average $46,463 |
| Kenyans | 51.0 /100 | #172 | Average $46,462 |
| Ghanaians | 50.3 /100 | #173 | Average $46,440 |
| Scandinavians | 50.0 /100 | #174 | Average $46,433 |
| Basques | 48.8 /100 | #175 | Average $46,399 |
| Danes | 48.6 /100 | #176 | Average $46,392 |
| Belgians | 48.0 /100 | #177 | Average $46,375 |
| Colombians | 47.1 /100 | #178 | Average $46,349 |
| English | 46.5 /100 | #179 | Average $46,334 |
| Puget Sound Salish | 46.5 /100 | #180 | Average $46,333 |
| Immigrants | Cameroon | 46.4 /100 | #181 | Average $46,329 |
| Swiss | 45.9 /100 | #182 | Average $46,315 |
| French | 45.2 /100 | #183 | Average $46,296 |
Demographics Similar to Yakama by Median Earnings
In terms of median earnings, the demographic groups most similar to Yakama are Immigrants from Mexico ($39,114, a difference of 0.020%), Immigrants from Congo ($39,169, a difference of 0.16%), Kiowa ($39,232, a difference of 0.32%), Houma ($38,949, a difference of 0.41%), and Spanish American Indian ($38,907, a difference of 0.52%).
| Demographics | Rating | Rank | Median Earnings |
| Creek | 0.0 /100 | #325 | Tragic $39,648 |
| Immigrants | Yemen | 0.0 /100 | #326 | Tragic $39,540 |
| Yuman | 0.0 /100 | #327 | Tragic $39,523 |
| Sioux | 0.0 /100 | #328 | Tragic $39,448 |
| Kiowa | 0.0 /100 | #329 | Tragic $39,232 |
| Immigrants | Congo | 0.0 /100 | #330 | Tragic $39,169 |
| Immigrants | Mexico | 0.0 /100 | #331 | Tragic $39,114 |
| Yakama | 0.0 /100 | #332 | Tragic $39,107 |
| Houma | 0.0 /100 | #333 | Tragic $38,949 |
| Spanish American Indians | 0.0 /100 | #334 | Tragic $38,907 |
| Natives/Alaskans | 0.0 /100 | #335 | Tragic $38,896 |
| Crow | 0.0 /100 | #336 | Tragic $38,707 |
| Immigrants | Cuba | 0.0 /100 | #337 | Tragic $38,426 |
| Pima | 0.0 /100 | #338 | Tragic $38,285 |
| Menominee | 0.0 /100 | #339 | Tragic $37,884 |