Osage vs Yakama Median Earnings
COMPARE
Osage
Yakama
Median Earnings
Median Earnings Comparison
Osage
Yakama
$42,651
MEDIAN EARNINGS
0.5/ 100
METRIC RATING
270th/ 347
METRIC RANK
$39,107
MEDIAN EARNINGS
0.0/ 100
METRIC RATING
332nd/ 347
METRIC RANK
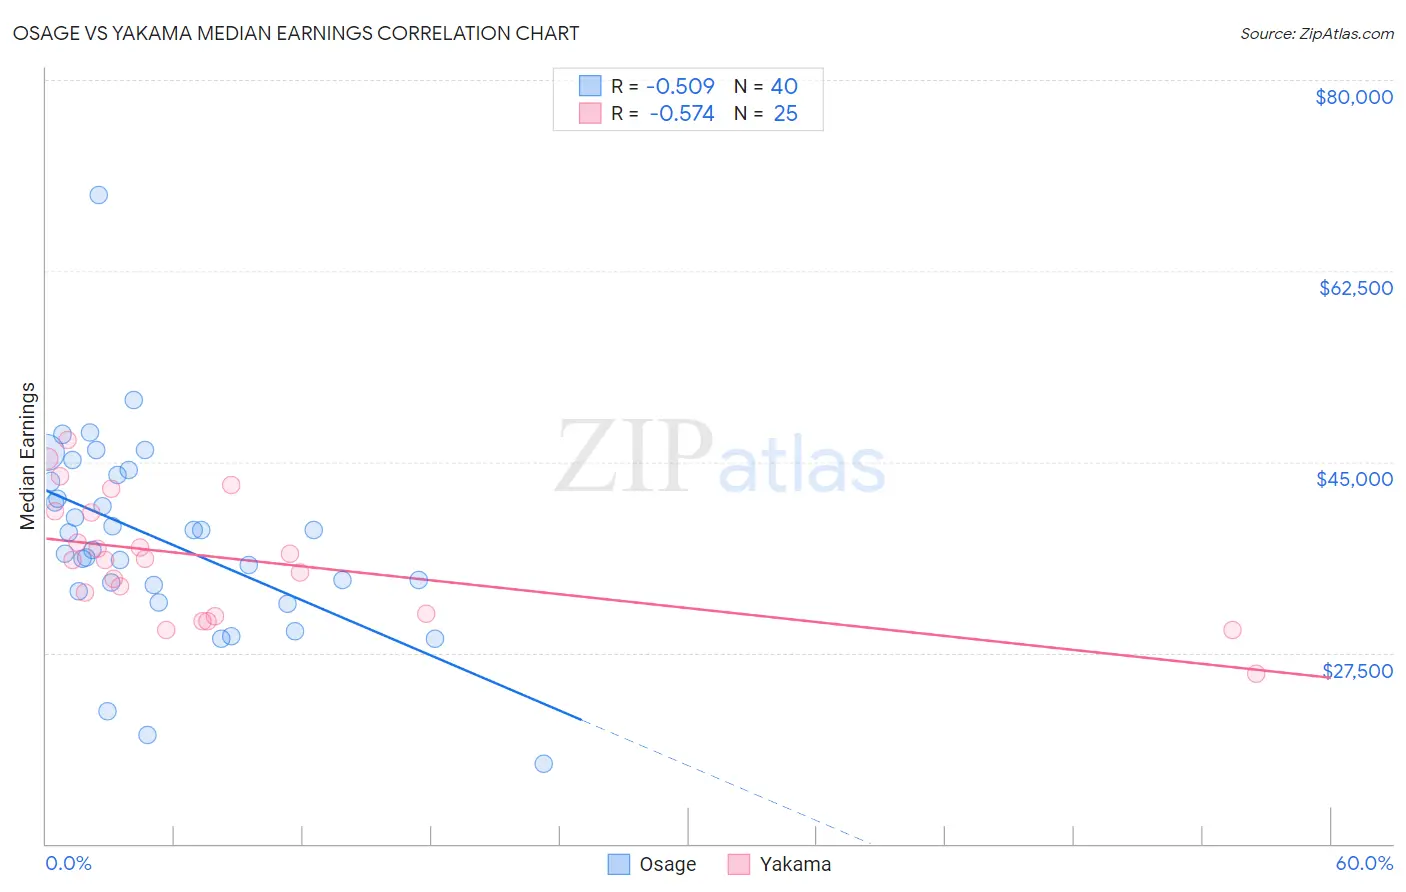
Osage vs Yakama Median Earnings Correlation Chart
The statistical analysis conducted on geographies consisting of 91,804,179 people shows a substantial negative correlation between the proportion of Osage and median earnings in the United States with a correlation coefficient (R) of -0.509 and weighted average of $42,651. Similarly, the statistical analysis conducted on geographies consisting of 19,920,783 people shows a substantial negative correlation between the proportion of Yakama and median earnings in the United States with a correlation coefficient (R) of -0.574 and weighted average of $39,107, a difference of 9.1%.
Median Earnings Correlation Summary
| Measurement | Osage | Yakama |
| Minimum | $17,308 | $25,625 |
| Maximum | $69,422 | $46,951 |
| Range | $52,114 | $21,326 |
| Mean | $37,848 | $36,082 |
| Median | $37,712 | $36,058 |
| Interquartile 25% (IQ1) | $33,454 | $30,946 |
| Interquartile 75% (IQ3) | $43,538 | $40,418 |
| Interquartile Range (IQR) | $10,084 | $9,471 |
| Standard Deviation (Sample) | $9,089 | $5,481 |
| Standard Deviation (Population) | $8,975 | $5,370 |
Similar Demographics by Median Earnings
Demographics Similar to Osage by Median Earnings
In terms of median earnings, the demographic groups most similar to Osage are Pennsylvania German ($42,615, a difference of 0.090%), Belizean ($42,702, a difference of 0.12%), American ($42,742, a difference of 0.21%), Cree ($42,777, a difference of 0.29%), and Iroquois ($42,430, a difference of 0.52%).
| Demographics | Rating | Rank | Median Earnings |
| Inupiat | 0.8 /100 | #263 | Tragic $43,000 |
| Immigrants | Liberia | 0.7 /100 | #264 | Tragic $42,923 |
| Salvadorans | 0.7 /100 | #265 | Tragic $42,912 |
| Immigrants | Laos | 0.7 /100 | #266 | Tragic $42,884 |
| Cree | 0.6 /100 | #267 | Tragic $42,777 |
| Americans | 0.6 /100 | #268 | Tragic $42,742 |
| Belizeans | 0.5 /100 | #269 | Tragic $42,702 |
| Osage | 0.5 /100 | #270 | Tragic $42,651 |
| Pennsylvania Germans | 0.5 /100 | #271 | Tragic $42,615 |
| Iroquois | 0.4 /100 | #272 | Tragic $42,430 |
| Immigrants | Dominica | 0.4 /100 | #273 | Tragic $42,420 |
| Immigrants | El Salvador | 0.4 /100 | #274 | Tragic $42,413 |
| Immigrants | Belize | 0.3 /100 | #275 | Tragic $42,339 |
| Spanish Americans | 0.3 /100 | #276 | Tragic $42,316 |
| Central Americans | 0.3 /100 | #277 | Tragic $42,280 |
Demographics Similar to Yakama by Median Earnings
In terms of median earnings, the demographic groups most similar to Yakama are Immigrants from Mexico ($39,114, a difference of 0.020%), Immigrants from Congo ($39,169, a difference of 0.16%), Kiowa ($39,232, a difference of 0.32%), Houma ($38,949, a difference of 0.41%), and Spanish American Indian ($38,907, a difference of 0.52%).
| Demographics | Rating | Rank | Median Earnings |
| Creek | 0.0 /100 | #325 | Tragic $39,648 |
| Immigrants | Yemen | 0.0 /100 | #326 | Tragic $39,540 |
| Yuman | 0.0 /100 | #327 | Tragic $39,523 |
| Sioux | 0.0 /100 | #328 | Tragic $39,448 |
| Kiowa | 0.0 /100 | #329 | Tragic $39,232 |
| Immigrants | Congo | 0.0 /100 | #330 | Tragic $39,169 |
| Immigrants | Mexico | 0.0 /100 | #331 | Tragic $39,114 |
| Yakama | 0.0 /100 | #332 | Tragic $39,107 |
| Houma | 0.0 /100 | #333 | Tragic $38,949 |
| Spanish American Indians | 0.0 /100 | #334 | Tragic $38,907 |
| Natives/Alaskans | 0.0 /100 | #335 | Tragic $38,896 |
| Crow | 0.0 /100 | #336 | Tragic $38,707 |
| Immigrants | Cuba | 0.0 /100 | #337 | Tragic $38,426 |
| Pima | 0.0 /100 | #338 | Tragic $38,285 |
| Menominee | 0.0 /100 | #339 | Tragic $37,884 |