Danish vs Irish Median Earnings
COMPARE
Danish
Irish
Median Earnings
Median Earnings Comparison
Danes
Irish
$46,392
MEDIAN EARNINGS
48.6/ 100
METRIC RATING
176th/ 347
METRIC RANK
$47,276
MEDIAN EARNINGS
76.6/ 100
METRIC RATING
156th/ 347
METRIC RANK
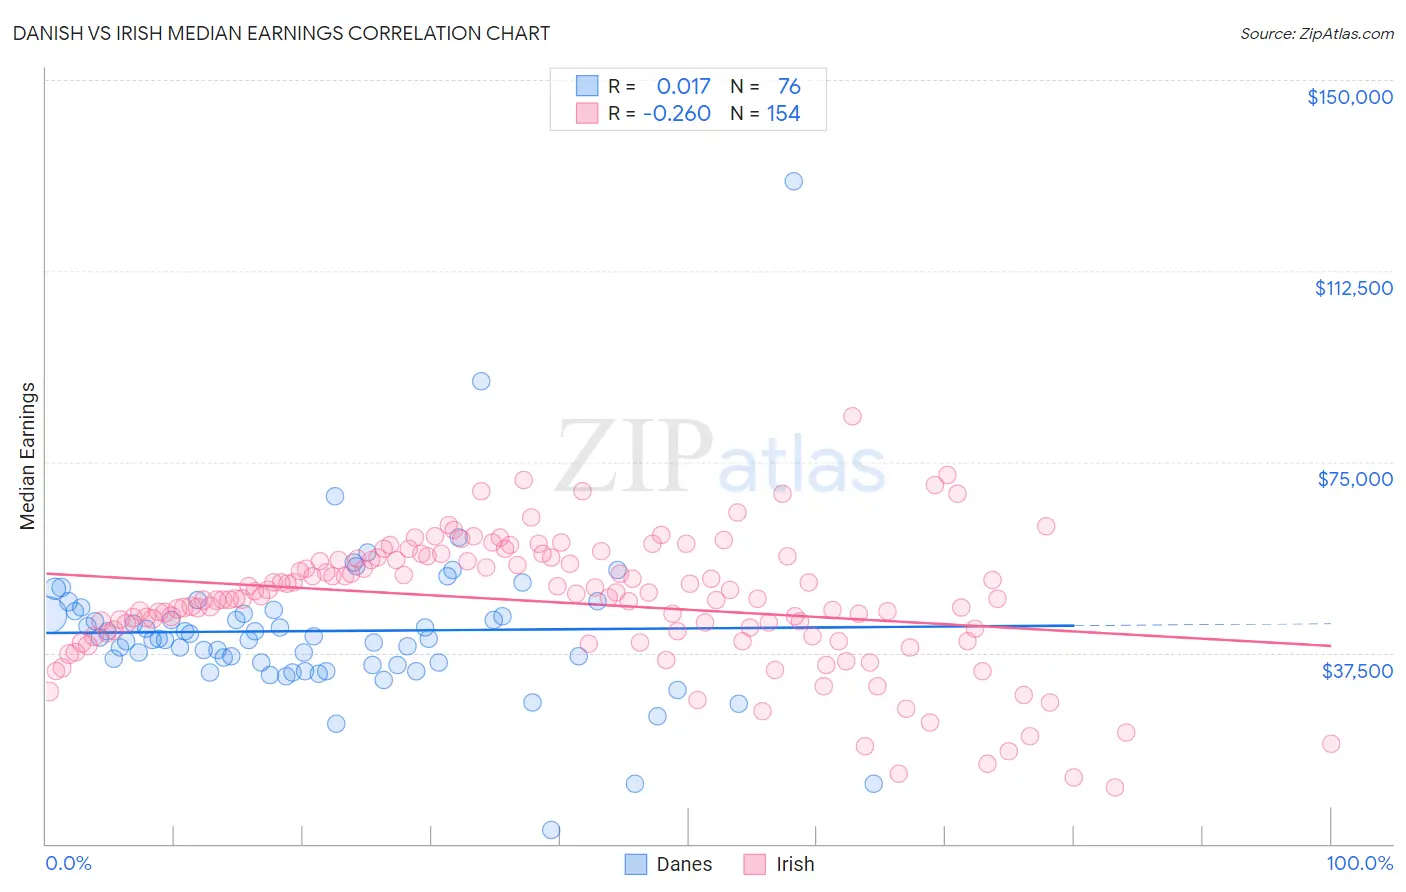
Danish vs Irish Median Earnings Correlation Chart
The statistical analysis conducted on geographies consisting of 474,068,327 people shows no correlation between the proportion of Danes and median earnings in the United States with a correlation coefficient (R) of 0.017 and weighted average of $46,392. Similarly, the statistical analysis conducted on geographies consisting of 579,915,662 people shows a weak negative correlation between the proportion of Irish and median earnings in the United States with a correlation coefficient (R) of -0.260 and weighted average of $47,276, a difference of 1.9%.
Median Earnings Correlation Summary
| Measurement | Danish | Irish |
| Minimum | $2,766 | $11,055 |
| Maximum | $130,117 | $83,906 |
| Range | $127,351 | $72,851 |
| Mean | $41,795 | $47,509 |
| Median | $40,260 | $48,301 |
| Interquartile 25% (IQ1) | $35,372 | $41,366 |
| Interquartile 75% (IQ3) | $45,489 | $56,002 |
| Interquartile Range (IQR) | $10,117 | $14,636 |
| Standard Deviation (Sample) | $15,565 | $12,668 |
| Standard Deviation (Population) | $15,462 | $12,626 |
Demographics Similar to Danes and Irish by Median Earnings
In terms of median earnings, the demographic groups most similar to Danes are Basque ($46,399, a difference of 0.020%), Scandinavian ($46,433, a difference of 0.090%), Ghanaian ($46,440, a difference of 0.10%), Scottish ($46,463, a difference of 0.15%), and Kenyan ($46,462, a difference of 0.15%). Similarly, the demographic groups most similar to Irish are Czech ($47,221, a difference of 0.12%), Slovak ($47,095, a difference of 0.38%), Immigrants from Peru ($47,025, a difference of 0.53%), Alsatian ($47,023, a difference of 0.54%), and Immigrants from Eastern Africa ($46,969, a difference of 0.65%).
| Demographics | Rating | Rank | Median Earnings |
| Irish | 76.6 /100 | #156 | Good $47,276 |
| Czechs | 75.1 /100 | #157 | Good $47,221 |
| Slovaks | 71.7 /100 | #158 | Good $47,095 |
| Immigrants | Peru | 69.6 /100 | #159 | Good $47,025 |
| Alsatians | 69.6 /100 | #160 | Good $47,023 |
| Immigrants | Eastern Africa | 68.0 /100 | #161 | Good $46,969 |
| South American Indians | 67.4 /100 | #162 | Good $46,952 |
| Icelanders | 66.3 /100 | #163 | Good $46,916 |
| Norwegians | 64.7 /100 | #164 | Good $46,865 |
| South Americans | 62.7 /100 | #165 | Good $46,804 |
| Czechoslovakians | 57.8 /100 | #166 | Average $46,658 |
| Costa Ricans | 57.4 /100 | #167 | Average $46,645 |
| Immigrants | Africa | 54.6 /100 | #168 | Average $46,564 |
| Immigrants | South America | 54.0 /100 | #169 | Average $46,548 |
| Immigrants | Immigrants | 51.6 /100 | #170 | Average $46,478 |
| Scottish | 51.1 /100 | #171 | Average $46,463 |
| Kenyans | 51.0 /100 | #172 | Average $46,462 |
| Ghanaians | 50.3 /100 | #173 | Average $46,440 |
| Scandinavians | 50.0 /100 | #174 | Average $46,433 |
| Basques | 48.8 /100 | #175 | Average $46,399 |
| Danes | 48.6 /100 | #176 | Average $46,392 |