Immigrants from Sweden vs Yakama Median Earnings
COMPARE
Immigrants from Sweden
Yakama
Median Earnings
Median Earnings Comparison
Immigrants from Sweden
Yakama
$54,478
MEDIAN EARNINGS
100.0/ 100
METRIC RATING
23rd/ 347
METRIC RANK
$39,107
MEDIAN EARNINGS
0.0/ 100
METRIC RATING
332nd/ 347
METRIC RANK
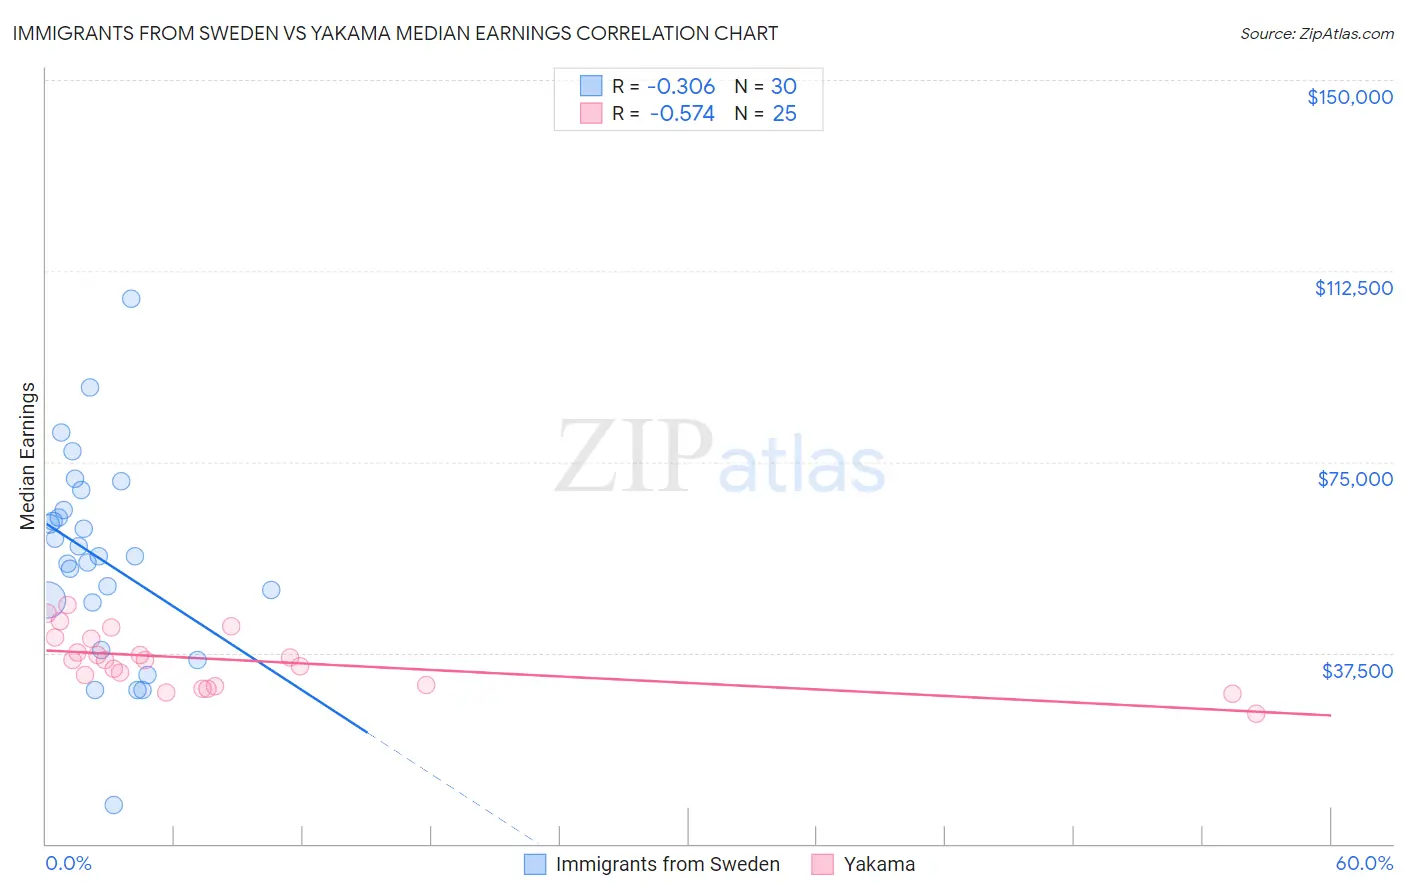
Immigrants from Sweden vs Yakama Median Earnings Correlation Chart
The statistical analysis conducted on geographies consisting of 164,745,494 people shows a mild negative correlation between the proportion of Immigrants from Sweden and median earnings in the United States with a correlation coefficient (R) of -0.306 and weighted average of $54,478. Similarly, the statistical analysis conducted on geographies consisting of 19,920,783 people shows a substantial negative correlation between the proportion of Yakama and median earnings in the United States with a correlation coefficient (R) of -0.574 and weighted average of $39,107, a difference of 39.3%.
Median Earnings Correlation Summary
| Measurement | Immigrants from Sweden | Yakama |
| Minimum | $7,643 | $25,625 |
| Maximum | $106,979 | $46,951 |
| Range | $99,336 | $21,326 |
| Mean | $56,044 | $36,082 |
| Median | $56,394 | $36,058 |
| Interquartile 25% (IQ1) | $47,341 | $30,946 |
| Interquartile 75% (IQ3) | $65,578 | $40,418 |
| Interquartile Range (IQR) | $18,237 | $9,471 |
| Standard Deviation (Sample) | $19,951 | $5,481 |
| Standard Deviation (Population) | $19,616 | $5,370 |
Similar Demographics by Median Earnings
Demographics Similar to Immigrants from Sweden by Median Earnings
In terms of median earnings, the demographic groups most similar to Immigrants from Sweden are Immigrants from Korea ($54,530, a difference of 0.10%), Burmese ($54,559, a difference of 0.15%), Cypriot ($54,589, a difference of 0.20%), Soviet Union ($54,290, a difference of 0.35%), and Immigrants from Belgium ($54,679, a difference of 0.37%).
| Demographics | Rating | Rank | Median Earnings |
| Immigrants | Eastern Asia | 100.0 /100 | #16 | Exceptional $56,183 |
| Eastern Europeans | 100.0 /100 | #17 | Exceptional $55,084 |
| Immigrants | Japan | 100.0 /100 | #18 | Exceptional $54,938 |
| Immigrants | Belgium | 100.0 /100 | #19 | Exceptional $54,679 |
| Cypriots | 100.0 /100 | #20 | Exceptional $54,589 |
| Burmese | 100.0 /100 | #21 | Exceptional $54,559 |
| Immigrants | Korea | 100.0 /100 | #22 | Exceptional $54,530 |
| Immigrants | Sweden | 100.0 /100 | #23 | Exceptional $54,478 |
| Soviet Union | 100.0 /100 | #24 | Exceptional $54,290 |
| Turks | 100.0 /100 | #25 | Exceptional $53,919 |
| Immigrants | Northern Europe | 100.0 /100 | #26 | Exceptional $53,872 |
| Asians | 100.0 /100 | #27 | Exceptional $53,690 |
| Immigrants | France | 100.0 /100 | #28 | Exceptional $53,490 |
| Immigrants | Russia | 100.0 /100 | #29 | Exceptional $53,457 |
| Cambodians | 100.0 /100 | #30 | Exceptional $53,386 |
Demographics Similar to Yakama by Median Earnings
In terms of median earnings, the demographic groups most similar to Yakama are Immigrants from Mexico ($39,114, a difference of 0.020%), Immigrants from Congo ($39,169, a difference of 0.16%), Kiowa ($39,232, a difference of 0.32%), Houma ($38,949, a difference of 0.41%), and Spanish American Indian ($38,907, a difference of 0.52%).
| Demographics | Rating | Rank | Median Earnings |
| Creek | 0.0 /100 | #325 | Tragic $39,648 |
| Immigrants | Yemen | 0.0 /100 | #326 | Tragic $39,540 |
| Yuman | 0.0 /100 | #327 | Tragic $39,523 |
| Sioux | 0.0 /100 | #328 | Tragic $39,448 |
| Kiowa | 0.0 /100 | #329 | Tragic $39,232 |
| Immigrants | Congo | 0.0 /100 | #330 | Tragic $39,169 |
| Immigrants | Mexico | 0.0 /100 | #331 | Tragic $39,114 |
| Yakama | 0.0 /100 | #332 | Tragic $39,107 |
| Houma | 0.0 /100 | #333 | Tragic $38,949 |
| Spanish American Indians | 0.0 /100 | #334 | Tragic $38,907 |
| Natives/Alaskans | 0.0 /100 | #335 | Tragic $38,896 |
| Crow | 0.0 /100 | #336 | Tragic $38,707 |
| Immigrants | Cuba | 0.0 /100 | #337 | Tragic $38,426 |
| Pima | 0.0 /100 | #338 | Tragic $38,285 |
| Menominee | 0.0 /100 | #339 | Tragic $37,884 |