Danish vs West Indian Median Earnings
COMPARE
Danish
West Indian
Median Earnings
Median Earnings Comparison
Danes
West Indians
$46,392
MEDIAN EARNINGS
48.6/ 100
METRIC RATING
176th/ 347
METRIC RANK
$45,132
MEDIAN EARNINGS
13.9/ 100
METRIC RATING
224th/ 347
METRIC RANK
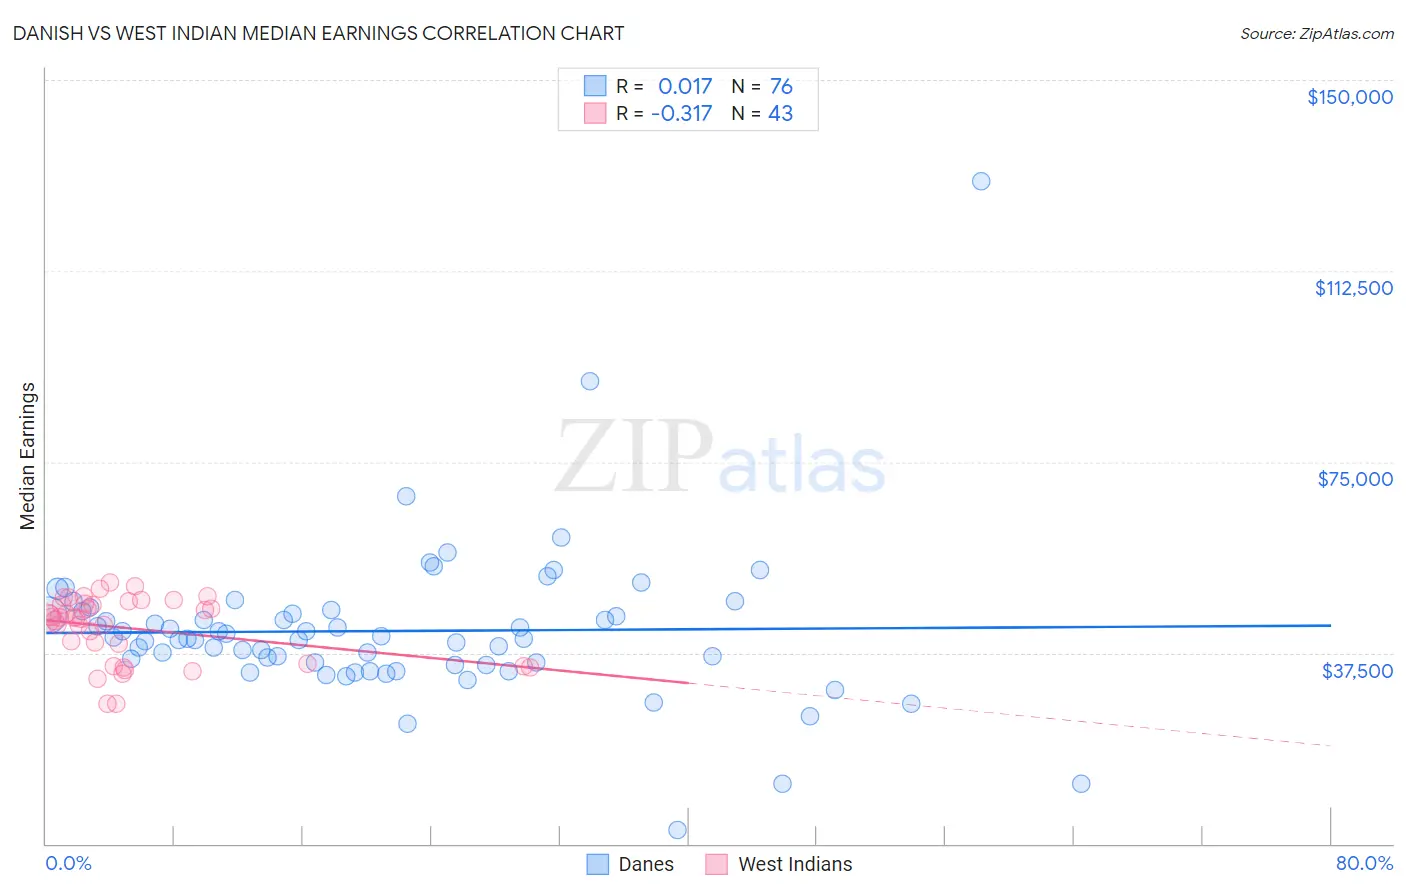
Danish vs West Indian Median Earnings Correlation Chart
The statistical analysis conducted on geographies consisting of 474,068,327 people shows no correlation between the proportion of Danes and median earnings in the United States with a correlation coefficient (R) of 0.017 and weighted average of $46,392. Similarly, the statistical analysis conducted on geographies consisting of 254,045,468 people shows a mild negative correlation between the proportion of West Indians and median earnings in the United States with a correlation coefficient (R) of -0.317 and weighted average of $45,132, a difference of 2.8%.
Median Earnings Correlation Summary
| Measurement | Danish | West Indian |
| Minimum | $2,766 | $27,409 |
| Maximum | $130,117 | $51,215 |
| Range | $127,351 | $23,806 |
| Mean | $41,795 | $42,337 |
| Median | $40,260 | $44,343 |
| Interquartile 25% (IQ1) | $35,372 | $35,256 |
| Interquartile 75% (IQ3) | $45,489 | $47,046 |
| Interquartile Range (IQR) | $10,117 | $11,790 |
| Standard Deviation (Sample) | $15,565 | $6,289 |
| Standard Deviation (Population) | $15,462 | $6,215 |
Similar Demographics by Median Earnings
Demographics Similar to Danes by Median Earnings
In terms of median earnings, the demographic groups most similar to Danes are Basque ($46,399, a difference of 0.020%), Belgian ($46,375, a difference of 0.040%), Scandinavian ($46,433, a difference of 0.090%), Colombian ($46,349, a difference of 0.090%), and Ghanaian ($46,440, a difference of 0.10%).
| Demographics | Rating | Rank | Median Earnings |
| Immigrants | South America | 54.0 /100 | #169 | Average $46,548 |
| Immigrants | Immigrants | 51.6 /100 | #170 | Average $46,478 |
| Scottish | 51.1 /100 | #171 | Average $46,463 |
| Kenyans | 51.0 /100 | #172 | Average $46,462 |
| Ghanaians | 50.3 /100 | #173 | Average $46,440 |
| Scandinavians | 50.0 /100 | #174 | Average $46,433 |
| Basques | 48.8 /100 | #175 | Average $46,399 |
| Danes | 48.6 /100 | #176 | Average $46,392 |
| Belgians | 48.0 /100 | #177 | Average $46,375 |
| Colombians | 47.1 /100 | #178 | Average $46,349 |
| English | 46.5 /100 | #179 | Average $46,334 |
| Puget Sound Salish | 46.5 /100 | #180 | Average $46,333 |
| Immigrants | Cameroon | 46.4 /100 | #181 | Average $46,329 |
| Swiss | 45.9 /100 | #182 | Average $46,315 |
| French | 45.2 /100 | #183 | Average $46,296 |
Demographics Similar to West Indians by Median Earnings
In terms of median earnings, the demographic groups most similar to West Indians are Immigrants from Cambodia ($45,090, a difference of 0.090%), Immigrants from Panama ($45,198, a difference of 0.15%), White/Caucasian ($45,197, a difference of 0.15%), Immigrants from Guyana ($45,204, a difference of 0.16%), and Ecuadorian ($45,214, a difference of 0.18%).
| Demographics | Rating | Rank | Median Earnings |
| Tlingit-Haida | 20.5 /100 | #217 | Fair $45,468 |
| Spanish | 19.7 /100 | #218 | Poor $45,432 |
| Dutch | 18.4 /100 | #219 | Poor $45,370 |
| Ecuadorians | 15.3 /100 | #220 | Poor $45,214 |
| Immigrants | Guyana | 15.1 /100 | #221 | Poor $45,204 |
| Immigrants | Panama | 15.0 /100 | #222 | Poor $45,198 |
| Whites/Caucasians | 15.0 /100 | #223 | Poor $45,197 |
| West Indians | 13.9 /100 | #224 | Poor $45,132 |
| Immigrants | Cambodia | 13.2 /100 | #225 | Poor $45,090 |
| Immigrants | Nigeria | 12.2 /100 | #226 | Poor $45,030 |
| Native Hawaiians | 12.2 /100 | #227 | Poor $45,027 |
| Immigrants | Iraq | 11.6 /100 | #228 | Poor $44,988 |
| Scotch-Irish | 10.7 /100 | #229 | Poor $44,924 |
| Immigrants | Western Africa | 10.3 /100 | #230 | Poor $44,893 |
| Japanese | 9.5 /100 | #231 | Tragic $44,825 |