Danish vs Chinese Median Earnings
COMPARE
Danish
Chinese
Median Earnings
Median Earnings Comparison
Danes
Chinese
$46,392
MEDIAN EARNINGS
48.6/ 100
METRIC RATING
176th/ 347
METRIC RANK
$48,836
MEDIAN EARNINGS
96.7/ 100
METRIC RATING
115th/ 347
METRIC RANK
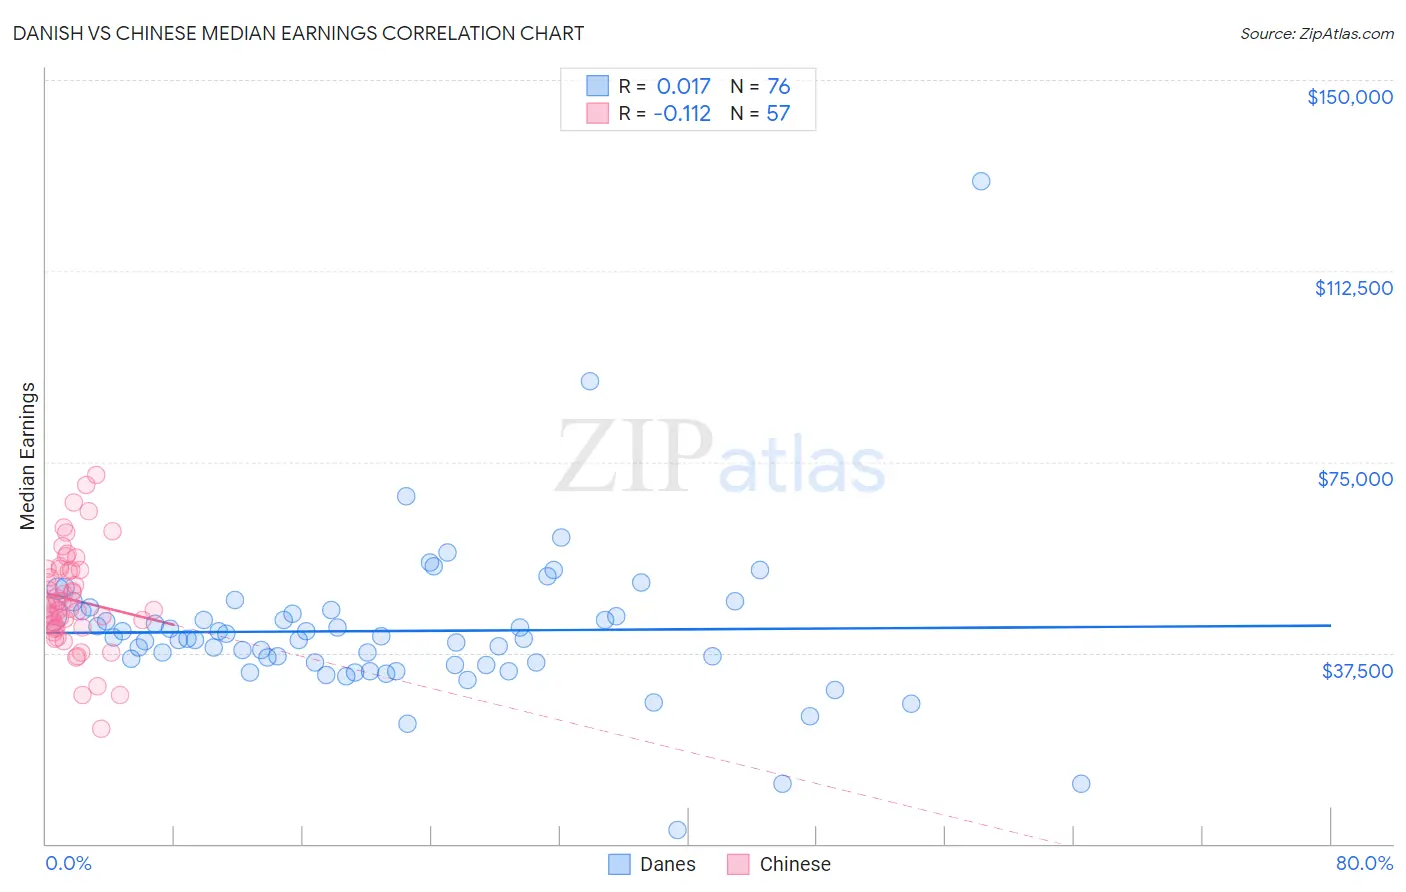
Danish vs Chinese Median Earnings Correlation Chart
The statistical analysis conducted on geographies consisting of 474,068,327 people shows no correlation between the proportion of Danes and median earnings in the United States with a correlation coefficient (R) of 0.017 and weighted average of $46,392. Similarly, the statistical analysis conducted on geographies consisting of 64,808,012 people shows a poor negative correlation between the proportion of Chinese and median earnings in the United States with a correlation coefficient (R) of -0.112 and weighted average of $48,836, a difference of 5.3%.
Median Earnings Correlation Summary
| Measurement | Danish | Chinese |
| Minimum | $2,766 | $22,468 |
| Maximum | $130,117 | $72,308 |
| Range | $127,351 | $49,840 |
| Mean | $41,795 | $47,945 |
| Median | $40,260 | $46,556 |
| Interquartile 25% (IQ1) | $35,372 | $42,425 |
| Interquartile 75% (IQ3) | $45,489 | $53,869 |
| Interquartile Range (IQR) | $10,117 | $11,444 |
| Standard Deviation (Sample) | $15,565 | $9,906 |
| Standard Deviation (Population) | $15,462 | $9,819 |
Similar Demographics by Median Earnings
Demographics Similar to Danes by Median Earnings
In terms of median earnings, the demographic groups most similar to Danes are Basque ($46,399, a difference of 0.020%), Belgian ($46,375, a difference of 0.040%), Scandinavian ($46,433, a difference of 0.090%), Colombian ($46,349, a difference of 0.090%), and Ghanaian ($46,440, a difference of 0.10%).
| Demographics | Rating | Rank | Median Earnings |
| Immigrants | South America | 54.0 /100 | #169 | Average $46,548 |
| Immigrants | Immigrants | 51.6 /100 | #170 | Average $46,478 |
| Scottish | 51.1 /100 | #171 | Average $46,463 |
| Kenyans | 51.0 /100 | #172 | Average $46,462 |
| Ghanaians | 50.3 /100 | #173 | Average $46,440 |
| Scandinavians | 50.0 /100 | #174 | Average $46,433 |
| Basques | 48.8 /100 | #175 | Average $46,399 |
| Danes | 48.6 /100 | #176 | Average $46,392 |
| Belgians | 48.0 /100 | #177 | Average $46,375 |
| Colombians | 47.1 /100 | #178 | Average $46,349 |
| English | 46.5 /100 | #179 | Average $46,334 |
| Puget Sound Salish | 46.5 /100 | #180 | Average $46,333 |
| Immigrants | Cameroon | 46.4 /100 | #181 | Average $46,329 |
| Swiss | 45.9 /100 | #182 | Average $46,315 |
| French | 45.2 /100 | #183 | Average $46,296 |
Demographics Similar to Chinese by Median Earnings
In terms of median earnings, the demographic groups most similar to Chinese are Moroccan ($48,838, a difference of 0.010%), Immigrants from Kuwait ($48,861, a difference of 0.050%), Northern European ($48,887, a difference of 0.10%), Immigrants from Zimbabwe ($48,913, a difference of 0.16%), and Immigrants from Ethiopia ($48,924, a difference of 0.18%).
| Demographics | Rating | Rank | Median Earnings |
| Palestinians | 98.0 /100 | #108 | Exceptional $49,209 |
| Syrians | 97.1 /100 | #109 | Exceptional $48,934 |
| Immigrants | Ethiopia | 97.1 /100 | #110 | Exceptional $48,924 |
| Immigrants | Zimbabwe | 97.0 /100 | #111 | Exceptional $48,913 |
| Northern Europeans | 96.9 /100 | #112 | Exceptional $48,887 |
| Immigrants | Kuwait | 96.8 /100 | #113 | Exceptional $48,861 |
| Moroccans | 96.7 /100 | #114 | Exceptional $48,838 |
| Chinese | 96.7 /100 | #115 | Exceptional $48,836 |
| Koreans | 96.2 /100 | #116 | Exceptional $48,727 |
| Serbians | 95.9 /100 | #117 | Exceptional $48,677 |
| Immigrants | Jordan | 95.9 /100 | #118 | Exceptional $48,673 |
| Poles | 95.8 /100 | #119 | Exceptional $48,659 |
| Carpatho Rusyns | 95.5 /100 | #120 | Exceptional $48,617 |
| Arabs | 95.4 /100 | #121 | Exceptional $48,599 |
| Chileans | 94.8 /100 | #122 | Exceptional $48,504 |