Danish vs Yugoslavian Median Earnings
COMPARE
Danish
Yugoslavian
Median Earnings
Median Earnings Comparison
Danes
Yugoslavians
$46,392
MEDIAN EARNINGS
48.6/ 100
METRIC RATING
176th/ 347
METRIC RANK
$45,846
MEDIAN EARNINGS
30.5/ 100
METRIC RATING
196th/ 347
METRIC RANK
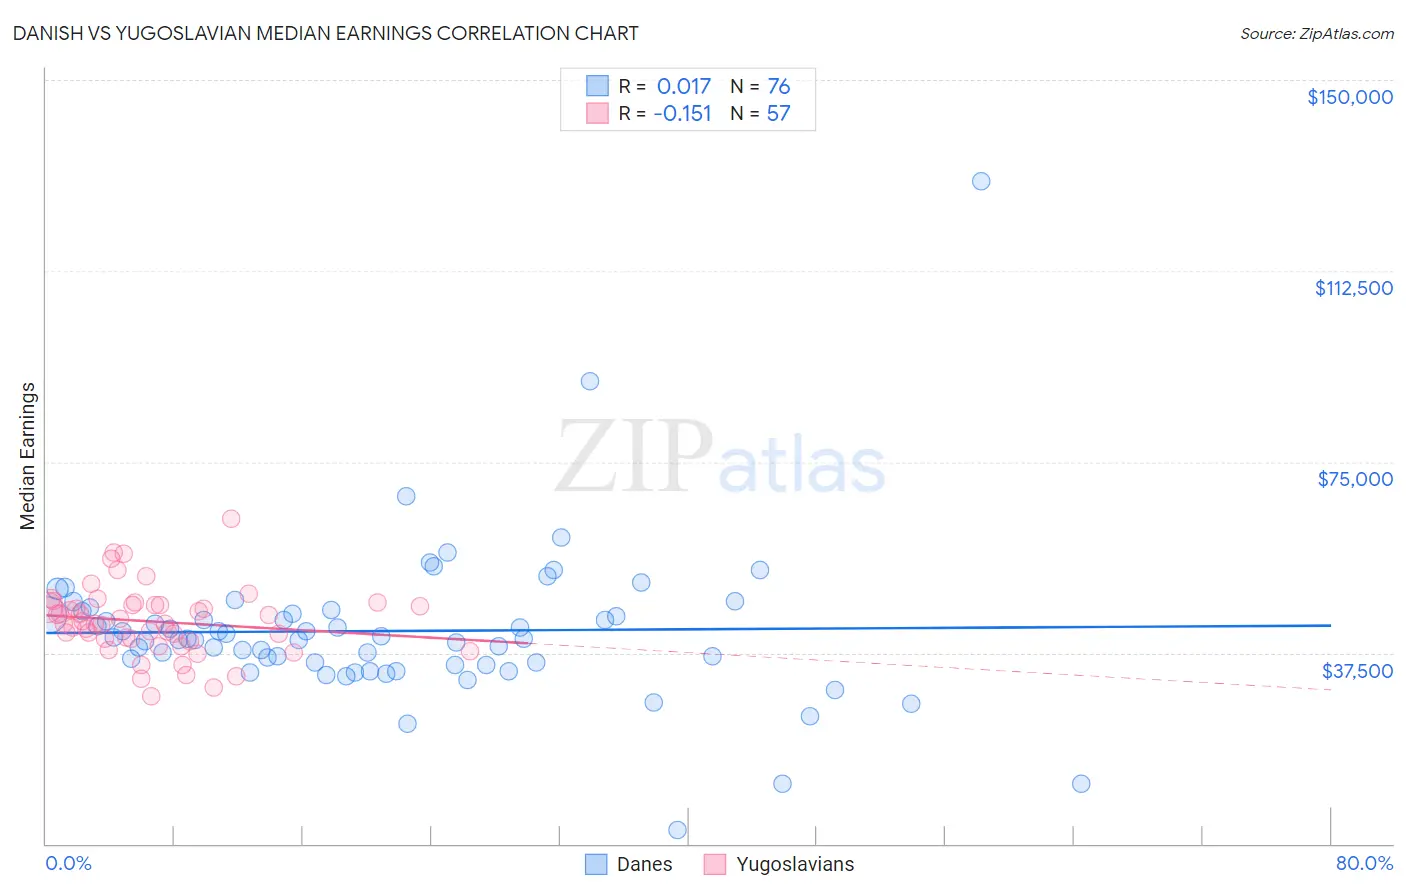
Danish vs Yugoslavian Median Earnings Correlation Chart
The statistical analysis conducted on geographies consisting of 474,068,327 people shows no correlation between the proportion of Danes and median earnings in the United States with a correlation coefficient (R) of 0.017 and weighted average of $46,392. Similarly, the statistical analysis conducted on geographies consisting of 285,700,192 people shows a poor negative correlation between the proportion of Yugoslavians and median earnings in the United States with a correlation coefficient (R) of -0.151 and weighted average of $45,846, a difference of 1.2%.
Median Earnings Correlation Summary
| Measurement | Danish | Yugoslavian |
| Minimum | $2,766 | $29,039 |
| Maximum | $130,117 | $63,892 |
| Range | $127,351 | $34,853 |
| Mean | $41,795 | $43,647 |
| Median | $40,260 | $43,187 |
| Interquartile 25% (IQ1) | $35,372 | $39,984 |
| Interquartile 75% (IQ3) | $45,489 | $46,857 |
| Interquartile Range (IQR) | $10,117 | $6,873 |
| Standard Deviation (Sample) | $15,565 | $6,694 |
| Standard Deviation (Population) | $15,462 | $6,635 |
Demographics Similar to Danes and Yugoslavians by Median Earnings
In terms of median earnings, the demographic groups most similar to Danes are Belgian ($46,375, a difference of 0.040%), Colombian ($46,349, a difference of 0.090%), English ($46,334, a difference of 0.13%), Puget Sound Salish ($46,333, a difference of 0.13%), and Immigrants from Cameroon ($46,329, a difference of 0.14%). Similarly, the demographic groups most similar to Yugoslavians are Immigrants from St. Vincent and the Grenadines ($45,908, a difference of 0.13%), Immigrants from Costa Rica ($45,928, a difference of 0.18%), German ($45,935, a difference of 0.19%), Guamanian/Chamorro ($45,933, a difference of 0.19%), and Finnish ($45,940, a difference of 0.20%).
| Demographics | Rating | Rank | Median Earnings |
| Danes | 48.6 /100 | #176 | Average $46,392 |
| Belgians | 48.0 /100 | #177 | Average $46,375 |
| Colombians | 47.1 /100 | #178 | Average $46,349 |
| English | 46.5 /100 | #179 | Average $46,334 |
| Puget Sound Salish | 46.5 /100 | #180 | Average $46,333 |
| Immigrants | Cameroon | 46.4 /100 | #181 | Average $46,329 |
| Swiss | 45.9 /100 | #182 | Average $46,315 |
| French | 45.2 /100 | #183 | Average $46,296 |
| Immigrants | Kenya | 42.4 /100 | #184 | Average $46,214 |
| Uruguayans | 41.6 /100 | #185 | Average $46,190 |
| Vietnamese | 40.9 /100 | #186 | Average $46,172 |
| Iraqis | 39.9 /100 | #187 | Fair $46,140 |
| Immigrants | Armenia | 38.3 /100 | #188 | Fair $46,094 |
| Spaniards | 37.2 /100 | #189 | Fair $46,059 |
| French Canadians | 36.1 /100 | #190 | Fair $46,026 |
| Finns | 33.4 /100 | #191 | Fair $45,940 |
| Germans | 33.2 /100 | #192 | Fair $45,935 |
| Guamanians/Chamorros | 33.2 /100 | #193 | Fair $45,933 |
| Immigrants | Costa Rica | 33.0 /100 | #194 | Fair $45,928 |
| Immigrants | St. Vincent and the Grenadines | 32.4 /100 | #195 | Fair $45,908 |
| Yugoslavians | 30.5 /100 | #196 | Fair $45,846 |