Immigrants from Venezuela vs Senegalese Median Earnings
COMPARE
Immigrants from Venezuela
Senegalese
Median Earnings
Median Earnings Comparison
Immigrants from Venezuela
Senegalese
$44,163
MEDIAN EARNINGS
4.0/ 100
METRIC RATING
242nd/ 347
METRIC RANK
$44,373
MEDIAN EARNINGS
5.3/ 100
METRIC RATING
239th/ 347
METRIC RANK
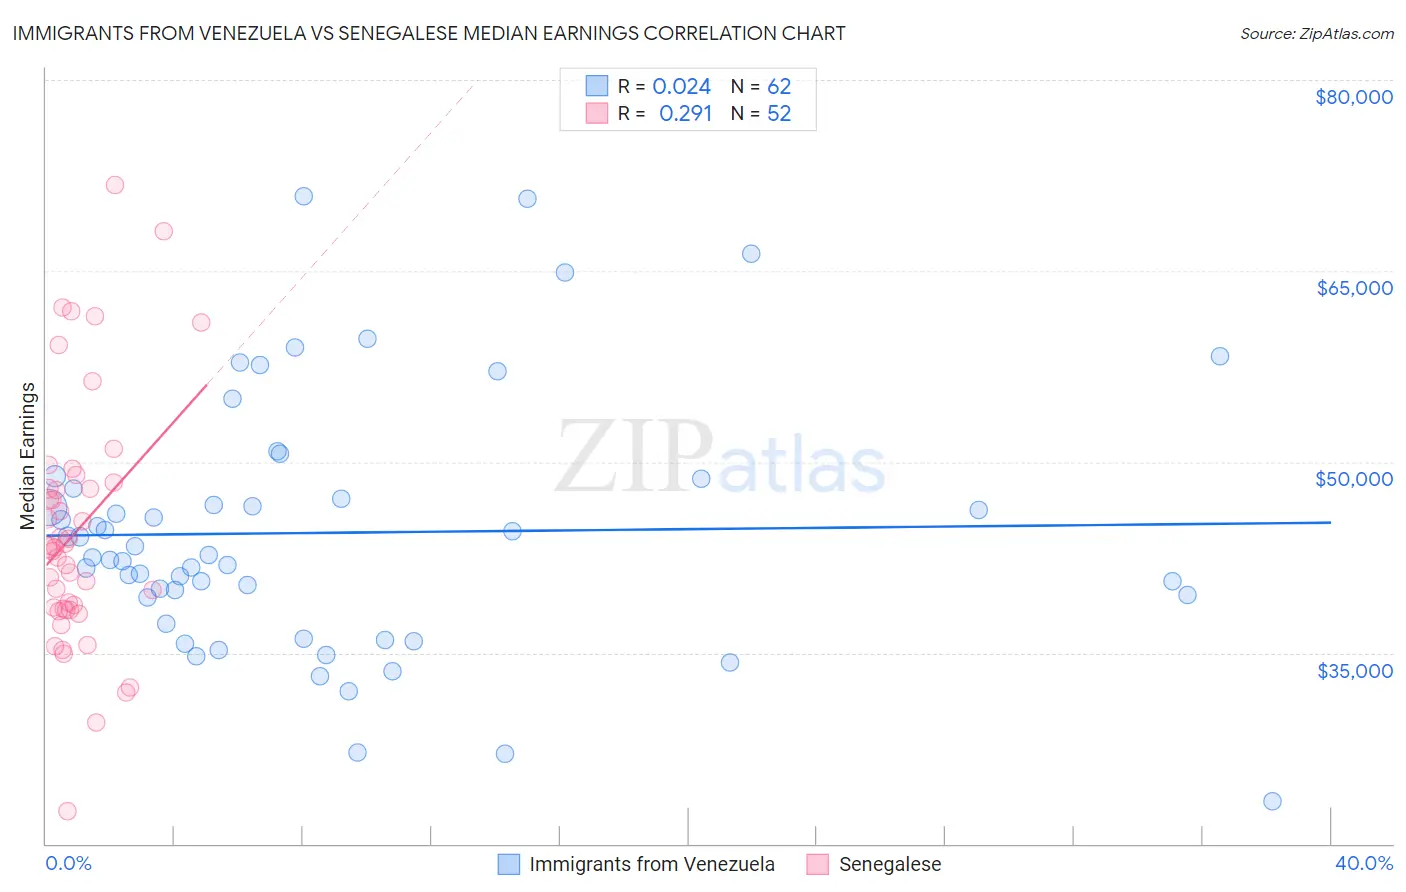
Immigrants from Venezuela vs Senegalese Median Earnings Correlation Chart
The statistical analysis conducted on geographies consisting of 287,839,546 people shows no correlation between the proportion of Immigrants from Venezuela and median earnings in the United States with a correlation coefficient (R) of 0.024 and weighted average of $44,163. Similarly, the statistical analysis conducted on geographies consisting of 78,107,065 people shows a weak positive correlation between the proportion of Senegalese and median earnings in the United States with a correlation coefficient (R) of 0.291 and weighted average of $44,373, a difference of 0.48%.
Median Earnings Correlation Summary
| Measurement | Immigrants from Venezuela | Senegalese |
| Minimum | $23,314 | $22,537 |
| Maximum | $70,871 | $71,772 |
| Range | $47,557 | $49,235 |
| Mean | $44,436 | $44,574 |
| Median | $42,584 | $43,248 |
| Interquartile 25% (IQ1) | $39,305 | $38,422 |
| Interquartile 75% (IQ3) | $47,920 | $48,145 |
| Interquartile Range (IQR) | $8,616 | $9,723 |
| Standard Deviation (Sample) | $9,975 | $9,701 |
| Standard Deviation (Population) | $9,895 | $9,608 |
Demographics Similar to Immigrants from Venezuela and Senegalese by Median Earnings
In terms of median earnings, the demographic groups most similar to Immigrants from Venezuela are Samoan ($44,206, a difference of 0.10%), Subsaharan African ($44,118, a difference of 0.10%), Nonimmigrants ($44,117, a difference of 0.10%), Aleut ($44,241, a difference of 0.18%), and Immigrants from Burma/Myanmar ($43,998, a difference of 0.37%). Similarly, the demographic groups most similar to Senegalese are Sudanese ($44,419, a difference of 0.10%), Immigrants from Ecuador ($44,462, a difference of 0.20%), Aleut ($44,241, a difference of 0.30%), Samoan ($44,206, a difference of 0.38%), and British West Indian ($44,552, a difference of 0.40%).
| Demographics | Rating | Rank | Median Earnings |
| Immigrants | Western Africa | 10.3 /100 | #230 | Poor $44,893 |
| Japanese | 9.5 /100 | #231 | Tragic $44,825 |
| Delaware | 9.0 /100 | #232 | Tragic $44,783 |
| Immigrants | Sudan | 8.8 /100 | #233 | Tragic $44,767 |
| Cape Verdeans | 7.5 /100 | #234 | Tragic $44,640 |
| Venezuelans | 6.9 /100 | #235 | Tragic $44,580 |
| British West Indians | 6.7 /100 | #236 | Tragic $44,552 |
| Immigrants | Ecuador | 5.9 /100 | #237 | Tragic $44,462 |
| Sudanese | 5.6 /100 | #238 | Tragic $44,419 |
| Senegalese | 5.3 /100 | #239 | Tragic $44,373 |
| Aleuts | 4.4 /100 | #240 | Tragic $44,241 |
| Samoans | 4.2 /100 | #241 | Tragic $44,206 |
| Immigrants | Venezuela | 4.0 /100 | #242 | Tragic $44,163 |
| Sub-Saharan Africans | 3.7 /100 | #243 | Tragic $44,118 |
| Immigrants | Nonimmigrants | 3.7 /100 | #244 | Tragic $44,117 |
| Immigrants | Burma/Myanmar | 3.2 /100 | #245 | Tragic $43,998 |
| Immigrants | West Indies | 3.1 /100 | #246 | Tragic $43,989 |
| Immigrants | Cabo Verde | 3.0 /100 | #247 | Tragic $43,963 |
| Nepalese | 2.6 /100 | #248 | Tragic $43,860 |
| Malaysians | 2.6 /100 | #249 | Tragic $43,844 |
| Alaska Natives | 2.3 /100 | #250 | Tragic $43,750 |