Danish vs Irish In Labor Force | Age 16-19
COMPARE
Danish
Irish
In Labor Force | Age 16-19
In Labor Force | Age 16-19 Comparison
Danes
Irish
44.7%
IN LABOR FORCE | AGE 16-19
100.0/ 100
METRIC RATING
7th/ 347
METRIC RANK
42.0%
IN LABOR FORCE | AGE 16-19
100.0/ 100
METRIC RATING
31st/ 347
METRIC RANK
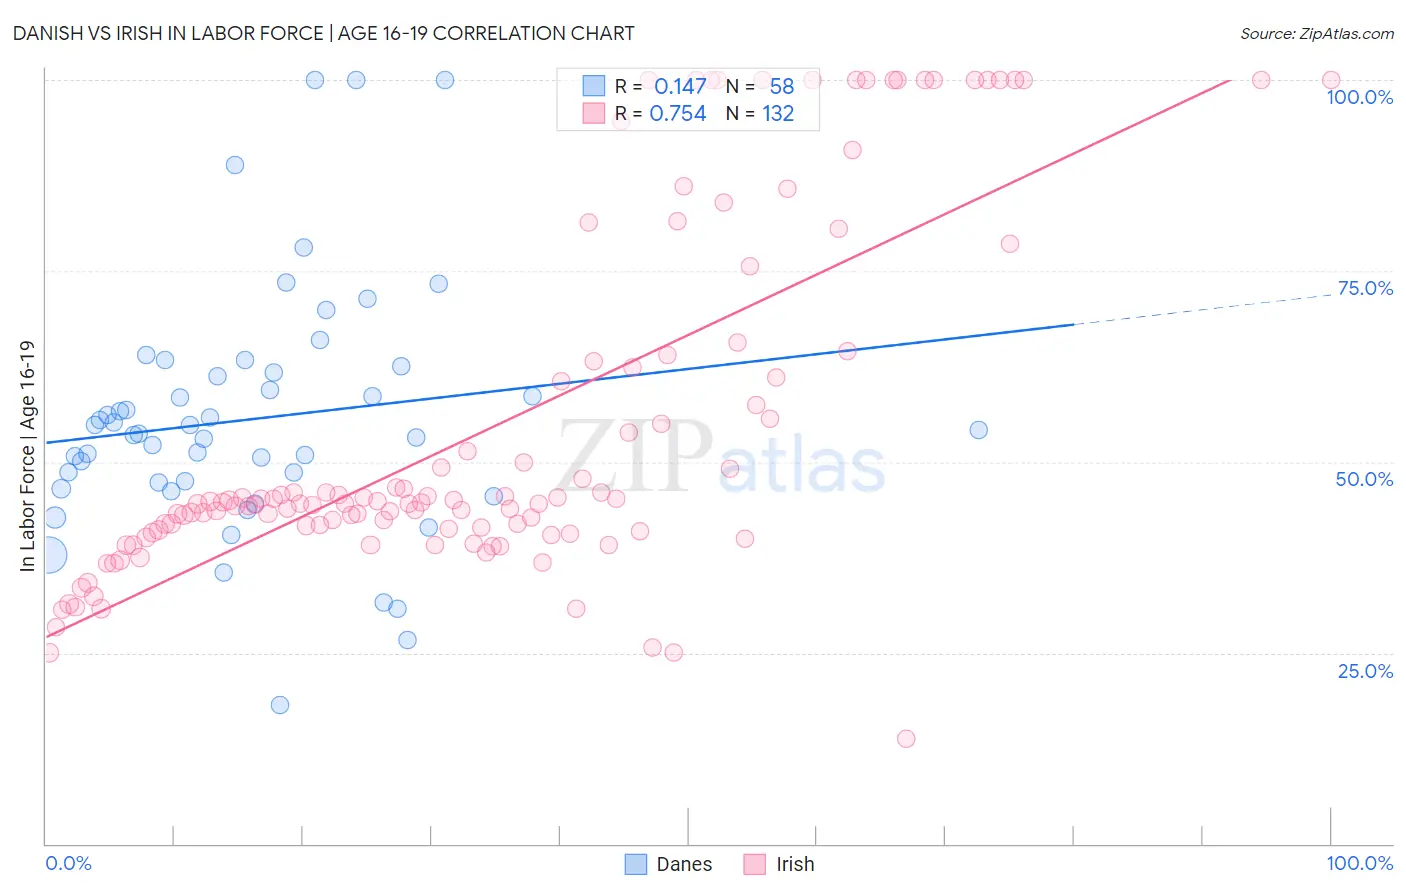
Danish vs Irish In Labor Force | Age 16-19 Correlation Chart
The statistical analysis conducted on geographies consisting of 472,554,362 people shows a poor positive correlation between the proportion of Danes and labor force participation rate among population between the ages 16 and 19 in the United States with a correlation coefficient (R) of 0.147 and weighted average of 44.7%. Similarly, the statistical analysis conducted on geographies consisting of 574,711,118 people shows a strong positive correlation between the proportion of Irish and labor force participation rate among population between the ages 16 and 19 in the United States with a correlation coefficient (R) of 0.754 and weighted average of 42.0%, a difference of 6.5%.
In Labor Force | Age 16-19 Correlation Summary
| Measurement | Danish | Irish |
| Minimum | 18.2% | 13.8% |
| Maximum | 100.0% | 100.0% |
| Range | 81.8% | 86.2% |
| Mean | 55.6% | 54.4% |
| Median | 53.9% | 44.6% |
| Interquartile 25% (IQ1) | 47.3% | 41.0% |
| Interquartile 75% (IQ3) | 61.7% | 62.8% |
| Interquartile Range (IQR) | 14.4% | 21.8% |
| Standard Deviation (Sample) | 16.1% | 22.9% |
| Standard Deviation (Population) | 16.0% | 22.8% |
Similar Demographics by In Labor Force | Age 16-19
Demographics Similar to Danes by In Labor Force | Age 16-19
In terms of in labor force | age 16-19, the demographic groups most similar to Danes are Immigrants from Cabo Verde (44.7%, a difference of 0.040%), Cape Verdean (44.5%, a difference of 0.46%), Somali (45.1%, a difference of 0.95%), Alaskan Athabascan (45.2%, a difference of 1.1%), and German (44.2%, a difference of 1.2%).
| Demographics | Rating | Rank | In Labor Force | Age 16-19 |
| Pennsylvania Germans | 100.0 /100 | #1 | Exceptional 46.4% |
| Norwegians | 100.0 /100 | #2 | Exceptional 46.2% |
| Immigrants | Somalia | 100.0 /100 | #3 | Exceptional 45.6% |
| Luxembourgers | 100.0 /100 | #4 | Exceptional 45.3% |
| Alaskan Athabascans | 100.0 /100 | #5 | Exceptional 45.2% |
| Somalis | 100.0 /100 | #6 | Exceptional 45.1% |
| Danes | 100.0 /100 | #7 | Exceptional 44.7% |
| Immigrants | Cabo Verde | 100.0 /100 | #8 | Exceptional 44.7% |
| Cape Verdeans | 100.0 /100 | #9 | Exceptional 44.5% |
| Germans | 100.0 /100 | #10 | Exceptional 44.2% |
| Swedes | 100.0 /100 | #11 | Exceptional 44.1% |
| Finns | 100.0 /100 | #12 | Exceptional 43.9% |
| Dutch | 100.0 /100 | #13 | Exceptional 43.8% |
| Chippewa | 100.0 /100 | #14 | Exceptional 43.8% |
| Slovenes | 100.0 /100 | #15 | Exceptional 43.7% |
Demographics Similar to Irish by In Labor Force | Age 16-19
In terms of in labor force | age 16-19, the demographic groups most similar to Irish are Scottish (42.0%, a difference of 0.070%), Czechoslovakian (41.9%, a difference of 0.20%), Liberian (41.8%, a difference of 0.34%), French (42.1%, a difference of 0.35%), and Polish (42.1%, a difference of 0.40%).
| Demographics | Rating | Rank | In Labor Force | Age 16-19 |
| Bangladeshis | 100.0 /100 | #24 | Exceptional 42.5% |
| German Russians | 100.0 /100 | #25 | Exceptional 42.4% |
| English | 100.0 /100 | #26 | Exceptional 42.4% |
| Welsh | 100.0 /100 | #27 | Exceptional 42.3% |
| Poles | 100.0 /100 | #28 | Exceptional 42.1% |
| French | 100.0 /100 | #29 | Exceptional 42.1% |
| Scottish | 100.0 /100 | #30 | Exceptional 42.0% |
| Irish | 100.0 /100 | #31 | Exceptional 42.0% |
| Czechoslovakians | 100.0 /100 | #32 | Exceptional 41.9% |
| Liberians | 100.0 /100 | #33 | Exceptional 41.8% |
| Immigrants | Bosnia and Herzegovina | 100.0 /100 | #34 | Exceptional 41.8% |
| Yugoslavians | 100.0 /100 | #35 | Exceptional 41.8% |
| Immigrants | Azores | 100.0 /100 | #36 | Exceptional 41.7% |
| Immigrants | Congo | 100.0 /100 | #37 | Exceptional 41.7% |
| Sioux | 100.0 /100 | #38 | Exceptional 41.5% |