Bangladeshi vs Irish Median Earnings
COMPARE
Bangladeshi
Irish
Median Earnings
Median Earnings Comparison
Bangladeshis
Irish
$41,263
MEDIAN EARNINGS
0.1/ 100
METRIC RATING
295th/ 347
METRIC RANK
$47,276
MEDIAN EARNINGS
76.6/ 100
METRIC RATING
156th/ 347
METRIC RANK
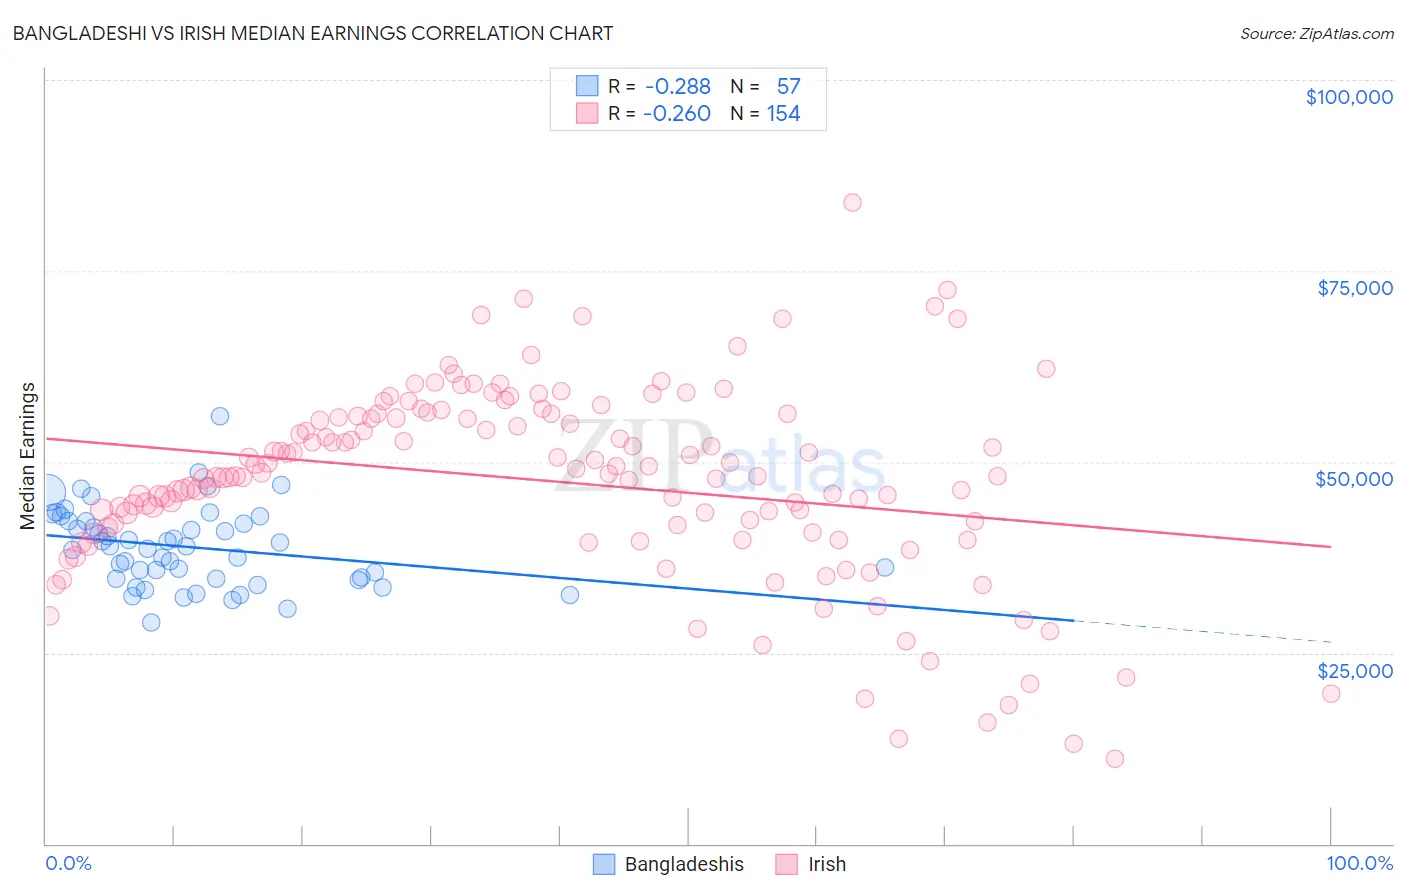
Bangladeshi vs Irish Median Earnings Correlation Chart
The statistical analysis conducted on geographies consisting of 141,452,923 people shows a weak negative correlation between the proportion of Bangladeshis and median earnings in the United States with a correlation coefficient (R) of -0.288 and weighted average of $41,263. Similarly, the statistical analysis conducted on geographies consisting of 579,915,662 people shows a weak negative correlation between the proportion of Irish and median earnings in the United States with a correlation coefficient (R) of -0.260 and weighted average of $47,276, a difference of 14.6%.
Median Earnings Correlation Summary
| Measurement | Bangladeshi | Irish |
| Minimum | $28,992 | $11,055 |
| Maximum | $55,893 | $83,906 |
| Range | $26,901 | $72,851 |
| Mean | $38,826 | $47,509 |
| Median | $38,964 | $48,301 |
| Interquartile 25% (IQ1) | $34,688 | $41,366 |
| Interquartile 75% (IQ3) | $42,288 | $56,002 |
| Interquartile Range (IQR) | $7,600 | $14,636 |
| Standard Deviation (Sample) | $5,171 | $12,668 |
| Standard Deviation (Population) | $5,125 | $12,626 |
Similar Demographics by Median Earnings
Demographics Similar to Bangladeshis by Median Earnings
In terms of median earnings, the demographic groups most similar to Bangladeshis are Cherokee ($41,252, a difference of 0.030%), Potawatomi ($41,288, a difference of 0.060%), Guatemalan ($41,205, a difference of 0.14%), Immigrants from Zaire ($41,325, a difference of 0.15%), and Immigrants from Micronesia ($41,133, a difference of 0.32%).
| Demographics | Rating | Rank | Median Earnings |
| Immigrants | Dominican Republic | 0.1 /100 | #288 | Tragic $41,554 |
| Comanche | 0.1 /100 | #289 | Tragic $41,519 |
| Paiute | 0.1 /100 | #290 | Tragic $41,508 |
| Central American Indians | 0.1 /100 | #291 | Tragic $41,474 |
| U.S. Virgin Islanders | 0.1 /100 | #292 | Tragic $41,448 |
| Immigrants | Zaire | 0.1 /100 | #293 | Tragic $41,325 |
| Potawatomi | 0.1 /100 | #294 | Tragic $41,288 |
| Bangladeshis | 0.1 /100 | #295 | Tragic $41,263 |
| Cherokee | 0.1 /100 | #296 | Tragic $41,252 |
| Guatemalans | 0.1 /100 | #297 | Tragic $41,205 |
| Immigrants | Micronesia | 0.1 /100 | #298 | Tragic $41,133 |
| Immigrants | Caribbean | 0.1 /100 | #299 | Tragic $41,119 |
| Ute | 0.1 /100 | #300 | Tragic $41,051 |
| Immigrants | Latin America | 0.1 /100 | #301 | Tragic $41,049 |
| Shoshone | 0.0 /100 | #302 | Tragic $40,932 |
Demographics Similar to Irish by Median Earnings
In terms of median earnings, the demographic groups most similar to Irish are Immigrants from Vietnam ($47,282, a difference of 0.010%), Immigrants from Portugal ($47,304, a difference of 0.060%), Czech ($47,221, a difference of 0.12%), Slovak ($47,095, a difference of 0.38%), and Slavic ($47,470, a difference of 0.41%).
| Demographics | Rating | Rank | Median Earnings |
| Luxembourgers | 84.5 /100 | #149 | Excellent $47,640 |
| Peruvians | 84.2 /100 | #150 | Excellent $47,628 |
| Immigrants | Oceania | 84.1 /100 | #151 | Excellent $47,617 |
| Immigrants | Germany | 83.1 /100 | #152 | Excellent $47,566 |
| Slavs | 81.1 /100 | #153 | Excellent $47,470 |
| Immigrants | Portugal | 77.3 /100 | #154 | Good $47,304 |
| Immigrants | Vietnam | 76.7 /100 | #155 | Good $47,282 |
| Irish | 76.6 /100 | #156 | Good $47,276 |
| Czechs | 75.1 /100 | #157 | Good $47,221 |
| Slovaks | 71.7 /100 | #158 | Good $47,095 |
| Immigrants | Peru | 69.6 /100 | #159 | Good $47,025 |
| Alsatians | 69.6 /100 | #160 | Good $47,023 |
| Immigrants | Eastern Africa | 68.0 /100 | #161 | Good $46,969 |
| South American Indians | 67.4 /100 | #162 | Good $46,952 |
| Icelanders | 66.3 /100 | #163 | Good $46,916 |