Tsimshian vs Irish Median Earnings
COMPARE
Tsimshian
Irish
Median Earnings
Median Earnings Comparison
Tsimshian
Irish
$43,695
MEDIAN EARNINGS
2.1/ 100
METRIC RATING
251st/ 347
METRIC RANK
$47,276
MEDIAN EARNINGS
76.6/ 100
METRIC RATING
156th/ 347
METRIC RANK
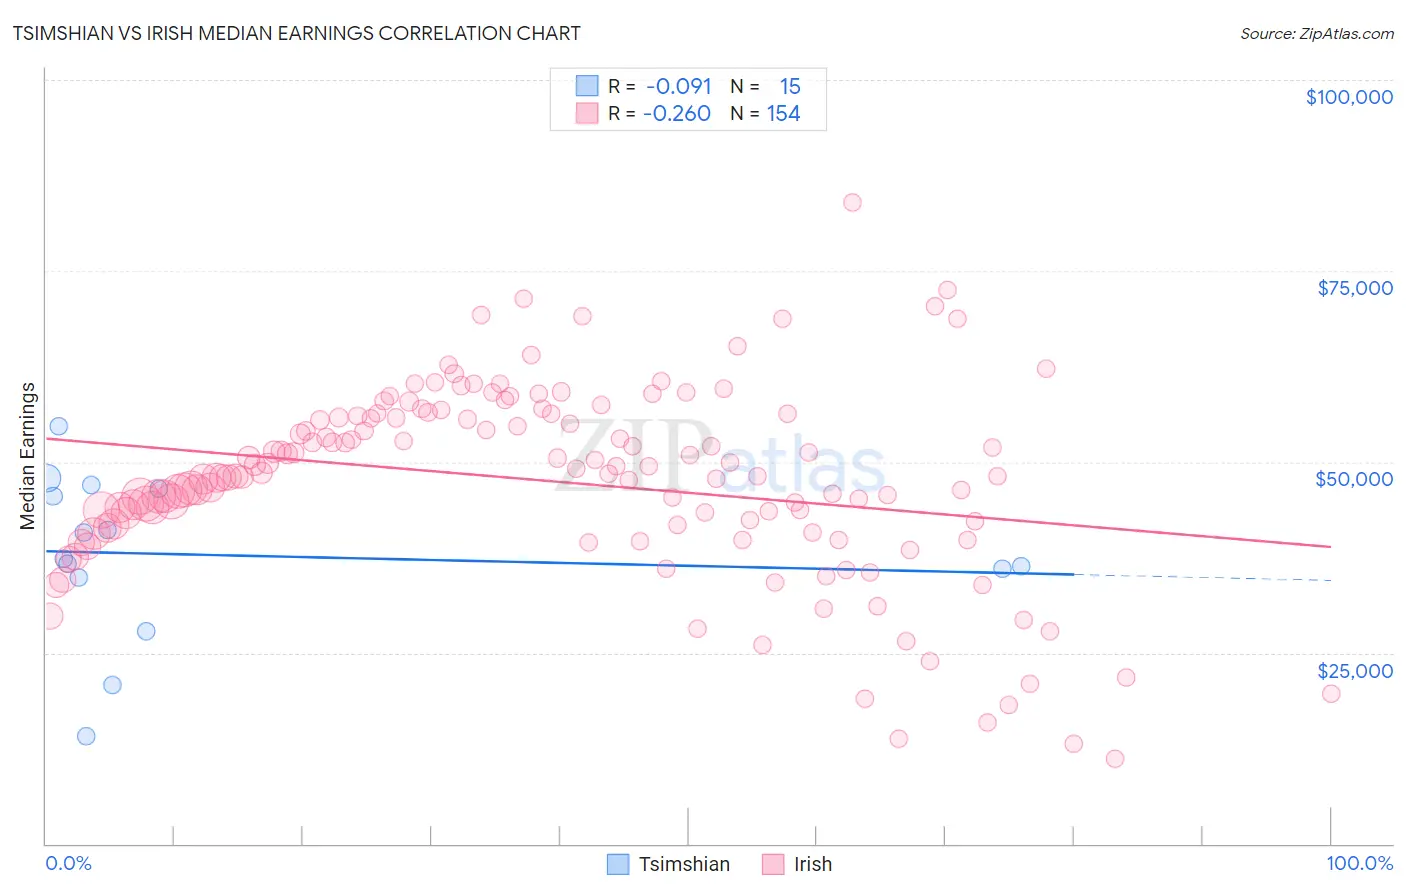
Tsimshian vs Irish Median Earnings Correlation Chart
The statistical analysis conducted on geographies consisting of 15,626,544 people shows a slight negative correlation between the proportion of Tsimshian and median earnings in the United States with a correlation coefficient (R) of -0.091 and weighted average of $43,695. Similarly, the statistical analysis conducted on geographies consisting of 579,915,662 people shows a weak negative correlation between the proportion of Irish and median earnings in the United States with a correlation coefficient (R) of -0.260 and weighted average of $47,276, a difference of 8.2%.
Median Earnings Correlation Summary
| Measurement | Tsimshian | Irish |
| Minimum | $14,091 | $11,055 |
| Maximum | $54,691 | $83,906 |
| Range | $40,600 | $72,851 |
| Mean | $37,810 | $47,509 |
| Median | $37,241 | $48,301 |
| Interquartile 25% (IQ1) | $34,814 | $41,366 |
| Interquartile 75% (IQ3) | $46,528 | $56,002 |
| Interquartile Range (IQR) | $11,714 | $14,636 |
| Standard Deviation (Sample) | $10,670 | $12,668 |
| Standard Deviation (Population) | $10,309 | $12,626 |
Similar Demographics by Median Earnings
Demographics Similar to Tsimshian by Median Earnings
In terms of median earnings, the demographic groups most similar to Tsimshian are Hawaiian ($43,673, a difference of 0.050%), Alaska Native ($43,750, a difference of 0.13%), Somali ($43,567, a difference of 0.30%), Malaysian ($43,844, a difference of 0.34%), and Liberian ($43,536, a difference of 0.37%).
| Demographics | Rating | Rank | Median Earnings |
| Immigrants | Nonimmigrants | 3.7 /100 | #244 | Tragic $44,117 |
| Immigrants | Burma/Myanmar | 3.2 /100 | #245 | Tragic $43,998 |
| Immigrants | West Indies | 3.1 /100 | #246 | Tragic $43,989 |
| Immigrants | Cabo Verde | 3.0 /100 | #247 | Tragic $43,963 |
| Nepalese | 2.6 /100 | #248 | Tragic $43,860 |
| Malaysians | 2.6 /100 | #249 | Tragic $43,844 |
| Alaska Natives | 2.3 /100 | #250 | Tragic $43,750 |
| Tsimshian | 2.1 /100 | #251 | Tragic $43,695 |
| Hawaiians | 2.0 /100 | #252 | Tragic $43,673 |
| Somalis | 1.8 /100 | #253 | Tragic $43,567 |
| Liberians | 1.7 /100 | #254 | Tragic $43,536 |
| Immigrants | Middle Africa | 1.4 /100 | #255 | Tragic $43,416 |
| Alaskan Athabascans | 1.4 /100 | #256 | Tragic $43,393 |
| Jamaicans | 1.3 /100 | #257 | Tragic $43,343 |
| French American Indians | 1.3 /100 | #258 | Tragic $43,333 |
Demographics Similar to Irish by Median Earnings
In terms of median earnings, the demographic groups most similar to Irish are Immigrants from Vietnam ($47,282, a difference of 0.010%), Immigrants from Portugal ($47,304, a difference of 0.060%), Czech ($47,221, a difference of 0.12%), Slovak ($47,095, a difference of 0.38%), and Slavic ($47,470, a difference of 0.41%).
| Demographics | Rating | Rank | Median Earnings |
| Luxembourgers | 84.5 /100 | #149 | Excellent $47,640 |
| Peruvians | 84.2 /100 | #150 | Excellent $47,628 |
| Immigrants | Oceania | 84.1 /100 | #151 | Excellent $47,617 |
| Immigrants | Germany | 83.1 /100 | #152 | Excellent $47,566 |
| Slavs | 81.1 /100 | #153 | Excellent $47,470 |
| Immigrants | Portugal | 77.3 /100 | #154 | Good $47,304 |
| Immigrants | Vietnam | 76.7 /100 | #155 | Good $47,282 |
| Irish | 76.6 /100 | #156 | Good $47,276 |
| Czechs | 75.1 /100 | #157 | Good $47,221 |
| Slovaks | 71.7 /100 | #158 | Good $47,095 |
| Immigrants | Peru | 69.6 /100 | #159 | Good $47,025 |
| Alsatians | 69.6 /100 | #160 | Good $47,023 |
| Immigrants | Eastern Africa | 68.0 /100 | #161 | Good $46,969 |
| South American Indians | 67.4 /100 | #162 | Good $46,952 |
| Icelanders | 66.3 /100 | #163 | Good $46,916 |