Immigrants from Nepal vs Irish Median Earnings
COMPARE
Immigrants from Nepal
Irish
Median Earnings
Median Earnings Comparison
Immigrants from Nepal
Irish
$47,925
MEDIAN EARNINGS
89.0/ 100
METRIC RATING
137th/ 347
METRIC RANK
$47,276
MEDIAN EARNINGS
76.6/ 100
METRIC RATING
156th/ 347
METRIC RANK
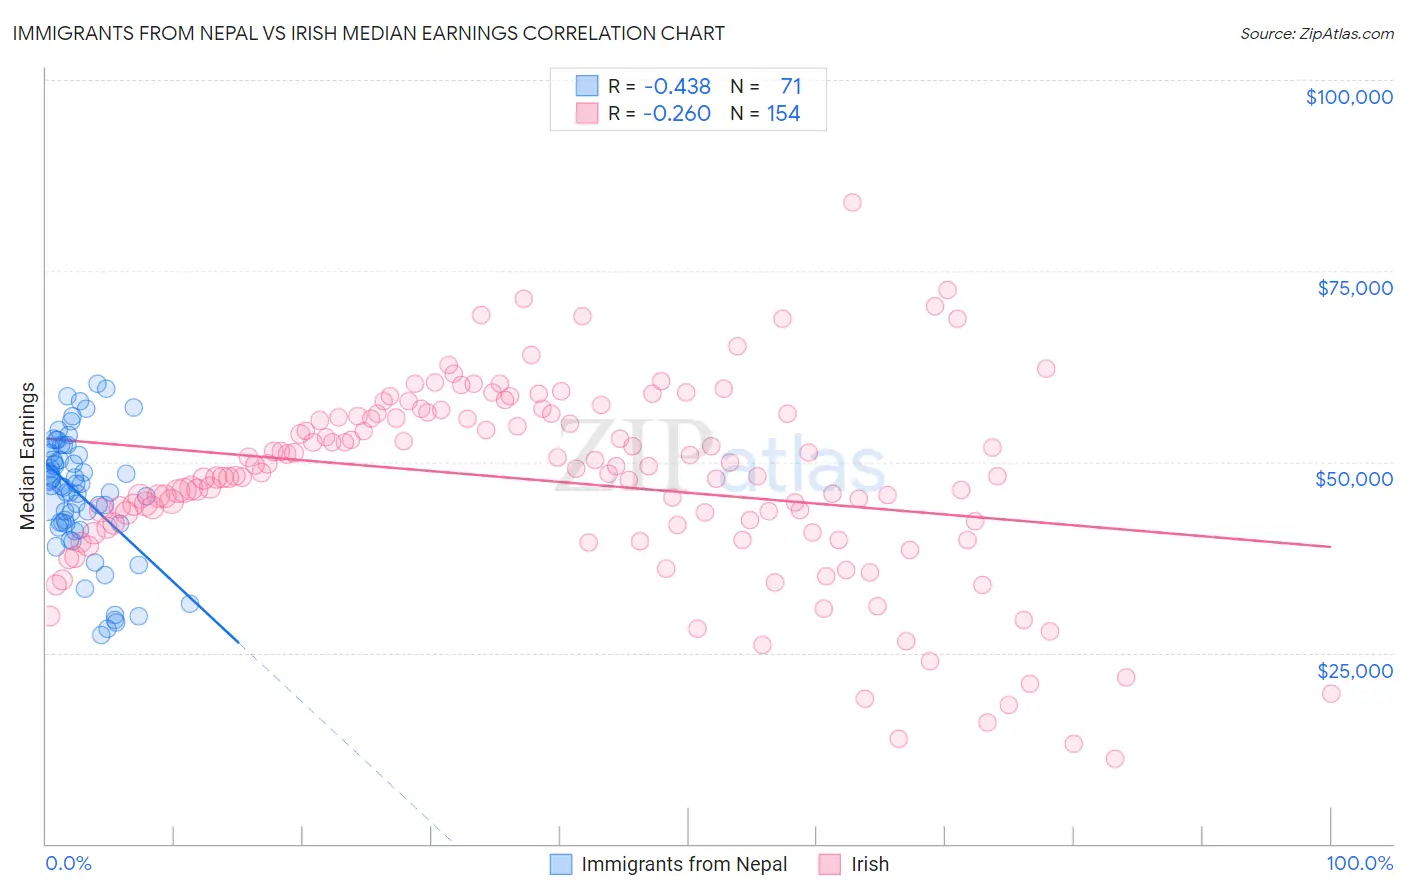
Immigrants from Nepal vs Irish Median Earnings Correlation Chart
The statistical analysis conducted on geographies consisting of 186,786,511 people shows a moderate negative correlation between the proportion of Immigrants from Nepal and median earnings in the United States with a correlation coefficient (R) of -0.438 and weighted average of $47,925. Similarly, the statistical analysis conducted on geographies consisting of 579,915,662 people shows a weak negative correlation between the proportion of Irish and median earnings in the United States with a correlation coefficient (R) of -0.260 and weighted average of $47,276, a difference of 1.4%.
Median Earnings Correlation Summary
| Measurement | Immigrants from Nepal | Irish |
| Minimum | $27,307 | $11,055 |
| Maximum | $60,227 | $83,906 |
| Range | $32,920 | $72,851 |
| Mean | $45,713 | $47,509 |
| Median | $46,771 | $48,301 |
| Interquartile 25% (IQ1) | $41,930 | $41,366 |
| Interquartile 75% (IQ3) | $51,099 | $56,002 |
| Interquartile Range (IQR) | $9,169 | $14,636 |
| Standard Deviation (Sample) | $7,950 | $12,668 |
| Standard Deviation (Population) | $7,894 | $12,626 |
Demographics Similar to Immigrants from Nepal and Irish by Median Earnings
In terms of median earnings, the demographic groups most similar to Immigrants from Nepal are European ($47,915, a difference of 0.020%), Canadian ($47,911, a difference of 0.030%), Taiwanese ($47,902, a difference of 0.050%), Immigrants from Sierra Leone ($47,875, a difference of 0.11%), and Slovene ($47,995, a difference of 0.15%). Similarly, the demographic groups most similar to Irish are Immigrants from Vietnam ($47,282, a difference of 0.010%), Immigrants from Portugal ($47,304, a difference of 0.060%), Slavic ($47,470, a difference of 0.41%), Immigrants from Germany ($47,566, a difference of 0.61%), and Immigrants from Oceania ($47,617, a difference of 0.72%).
| Demographics | Rating | Rank | Median Earnings |
| Slovenes | 90.0 /100 | #136 | Excellent $47,995 |
| Immigrants | Nepal | 89.0 /100 | #137 | Excellent $47,925 |
| Europeans | 88.9 /100 | #138 | Excellent $47,915 |
| Canadians | 88.8 /100 | #139 | Excellent $47,911 |
| Taiwanese | 88.7 /100 | #140 | Excellent $47,902 |
| Immigrants | Sierra Leone | 88.3 /100 | #141 | Excellent $47,875 |
| Ugandans | 88.0 /100 | #142 | Excellent $47,854 |
| Swedes | 88.0 /100 | #143 | Excellent $47,851 |
| Hungarians | 87.1 /100 | #144 | Excellent $47,795 |
| Immigrants | Saudi Arabia | 85.6 /100 | #145 | Excellent $47,704 |
| Immigrants | Chile | 85.5 /100 | #146 | Excellent $47,697 |
| Immigrants | South Eastern Asia | 85.0 /100 | #147 | Excellent $47,671 |
| Immigrants | Eritrea | 84.8 /100 | #148 | Excellent $47,657 |
| Luxembourgers | 84.5 /100 | #149 | Excellent $47,640 |
| Peruvians | 84.2 /100 | #150 | Excellent $47,628 |
| Immigrants | Oceania | 84.1 /100 | #151 | Excellent $47,617 |
| Immigrants | Germany | 83.1 /100 | #152 | Excellent $47,566 |
| Slavs | 81.1 /100 | #153 | Excellent $47,470 |
| Immigrants | Portugal | 77.3 /100 | #154 | Good $47,304 |
| Immigrants | Vietnam | 76.7 /100 | #155 | Good $47,282 |
| Irish | 76.6 /100 | #156 | Good $47,276 |