Danish vs Immigrants from Singapore Hearing Disability
COMPARE
Danish
Immigrants from Singapore
Hearing Disability
Hearing Disability Comparison
Danes
Immigrants from Singapore
3.6%
HEARING DISABILITY
0.0/ 100
METRIC RATING
276th/ 347
METRIC RANK
2.6%
HEARING DISABILITY
99.3/ 100
METRIC RATING
48th/ 347
METRIC RANK
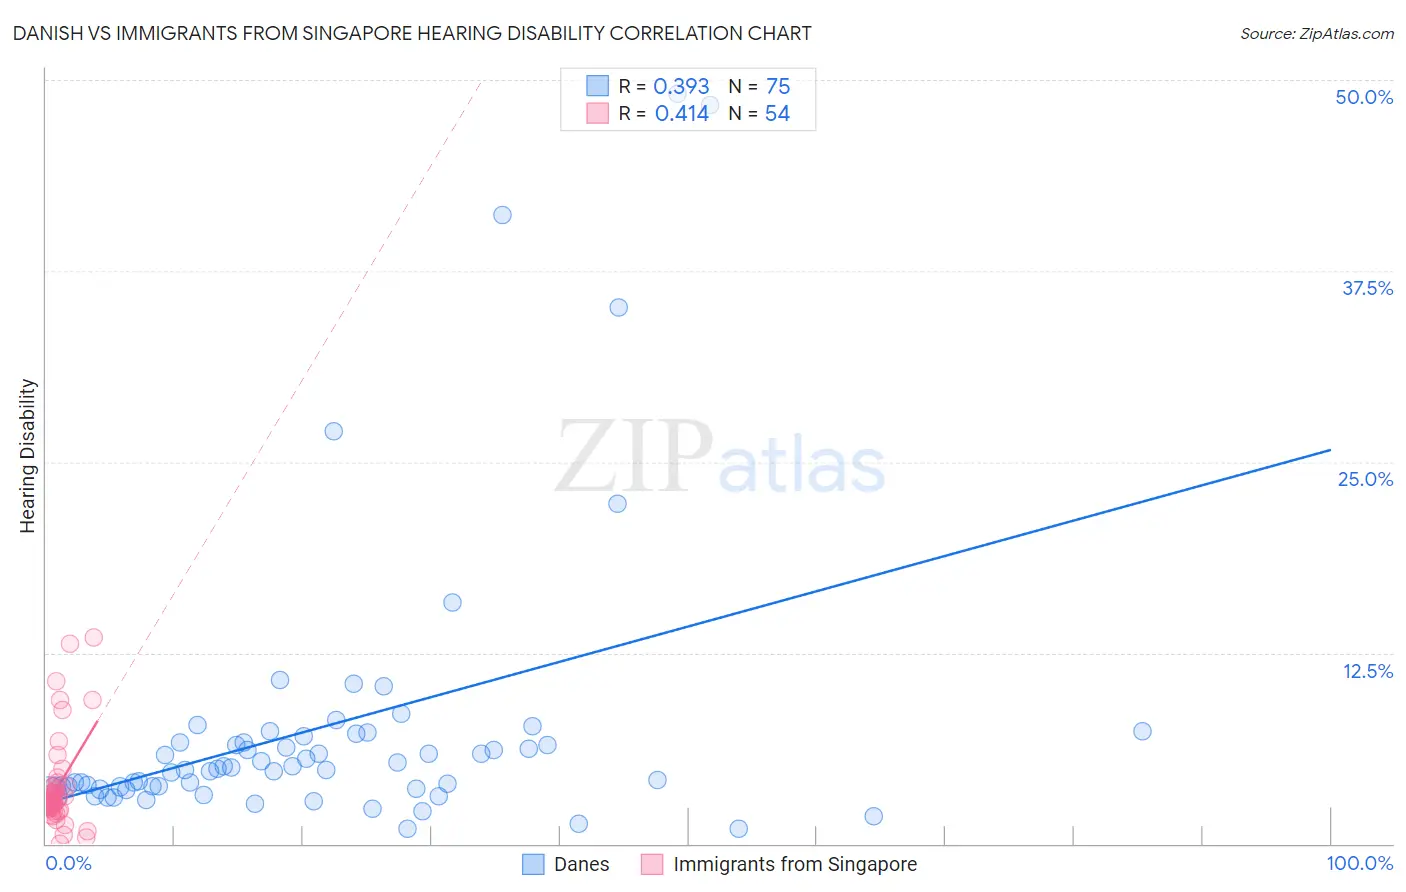
Danish vs Immigrants from Singapore Hearing Disability Correlation Chart
The statistical analysis conducted on geographies consisting of 473,961,057 people shows a mild positive correlation between the proportion of Danes and percentage of population with hearing disability in the United States with a correlation coefficient (R) of 0.393 and weighted average of 3.6%. Similarly, the statistical analysis conducted on geographies consisting of 137,507,103 people shows a moderate positive correlation between the proportion of Immigrants from Singapore and percentage of population with hearing disability in the United States with a correlation coefficient (R) of 0.414 and weighted average of 2.6%, a difference of 34.2%.
Hearing Disability Correlation Summary
| Measurement | Danish | Immigrants from Singapore |
| Minimum | 0.96% | 0.0083% |
| Maximum | 49.1% | 13.5% |
| Range | 48.2% | 13.5% |
| Mean | 7.7% | 3.6% |
| Median | 4.9% | 2.7% |
| Interquartile 25% (IQ1) | 3.7% | 2.4% |
| Interquartile 75% (IQ3) | 7.1% | 3.7% |
| Interquartile Range (IQR) | 3.4% | 1.3% |
| Standard Deviation (Sample) | 9.5% | 2.9% |
| Standard Deviation (Population) | 9.5% | 2.8% |
Similar Demographics by Hearing Disability
Demographics Similar to Danes by Hearing Disability
In terms of hearing disability, the demographic groups most similar to Danes are Czechoslovakian (3.6%, a difference of 0.12%), Swiss (3.5%, a difference of 0.32%), Puerto Rican (3.5%, a difference of 0.64%), Nonimmigrants (3.6%, a difference of 0.70%), and Fijian (3.5%, a difference of 0.72%).
| Demographics | Rating | Rank | Hearing Disability |
| Ute | 0.1 /100 | #269 | Tragic 3.5% |
| Europeans | 0.1 /100 | #270 | Tragic 3.5% |
| Czechs | 0.1 /100 | #271 | Tragic 3.5% |
| Fijians | 0.0 /100 | #272 | Tragic 3.5% |
| Puerto Ricans | 0.0 /100 | #273 | Tragic 3.5% |
| Swiss | 0.0 /100 | #274 | Tragic 3.5% |
| Czechoslovakians | 0.0 /100 | #275 | Tragic 3.6% |
| Danes | 0.0 /100 | #276 | Tragic 3.6% |
| Immigrants | Nonimmigrants | 0.0 /100 | #277 | Tragic 3.6% |
| Basques | 0.0 /100 | #278 | Tragic 3.6% |
| Slovaks | 0.0 /100 | #279 | Tragic 3.6% |
| French American Indians | 0.0 /100 | #280 | Tragic 3.6% |
| Scandinavians | 0.0 /100 | #281 | Tragic 3.6% |
| Swedes | 0.0 /100 | #282 | Tragic 3.6% |
| Blackfeet | 0.0 /100 | #283 | Tragic 3.6% |
Demographics Similar to Immigrants from Singapore by Hearing Disability
In terms of hearing disability, the demographic groups most similar to Immigrants from Singapore are Immigrants from Israel (2.6%, a difference of 0.070%), Immigrants from South America (2.7%, a difference of 0.12%), Immigrants from Dominica (2.6%, a difference of 0.21%), Paraguayan (2.7%, a difference of 0.31%), and Venezuelan (2.6%, a difference of 0.32%).
| Demographics | Rating | Rank | Hearing Disability |
| Immigrants | Taiwan | 99.4 /100 | #41 | Exceptional 2.6% |
| West Indians | 99.4 /100 | #42 | Exceptional 2.6% |
| Senegalese | 99.4 /100 | #43 | Exceptional 2.6% |
| Nigerians | 99.4 /100 | #44 | Exceptional 2.6% |
| Venezuelans | 99.4 /100 | #45 | Exceptional 2.6% |
| Immigrants | Dominica | 99.3 /100 | #46 | Exceptional 2.6% |
| Immigrants | Israel | 99.3 /100 | #47 | Exceptional 2.6% |
| Immigrants | Singapore | 99.3 /100 | #48 | Exceptional 2.6% |
| Immigrants | South America | 99.2 /100 | #49 | Exceptional 2.7% |
| Paraguayans | 99.2 /100 | #50 | Exceptional 2.7% |
| Immigrants | Hong Kong | 99.2 /100 | #51 | Exceptional 2.7% |
| Jamaicans | 99.0 /100 | #52 | Exceptional 2.7% |
| Immigrants | Eastern Asia | 99.0 /100 | #53 | Exceptional 2.7% |
| Ethiopians | 99.0 /100 | #54 | Exceptional 2.7% |
| Immigrants | Ethiopia | 99.0 /100 | #55 | Exceptional 2.7% |