Chinese vs Nigerian Median Household Income
COMPARE
Chinese
Nigerian
Median Household Income
Median Household Income Comparison
Chinese
Nigerians
$98,496
MEDIAN HOUSEHOLD INCOME
100.0/ 100
METRIC RATING
33rd/ 347
METRIC RANK
$81,725
MEDIAN HOUSEHOLD INCOME
10.3/ 100
METRIC RATING
219th/ 347
METRIC RANK
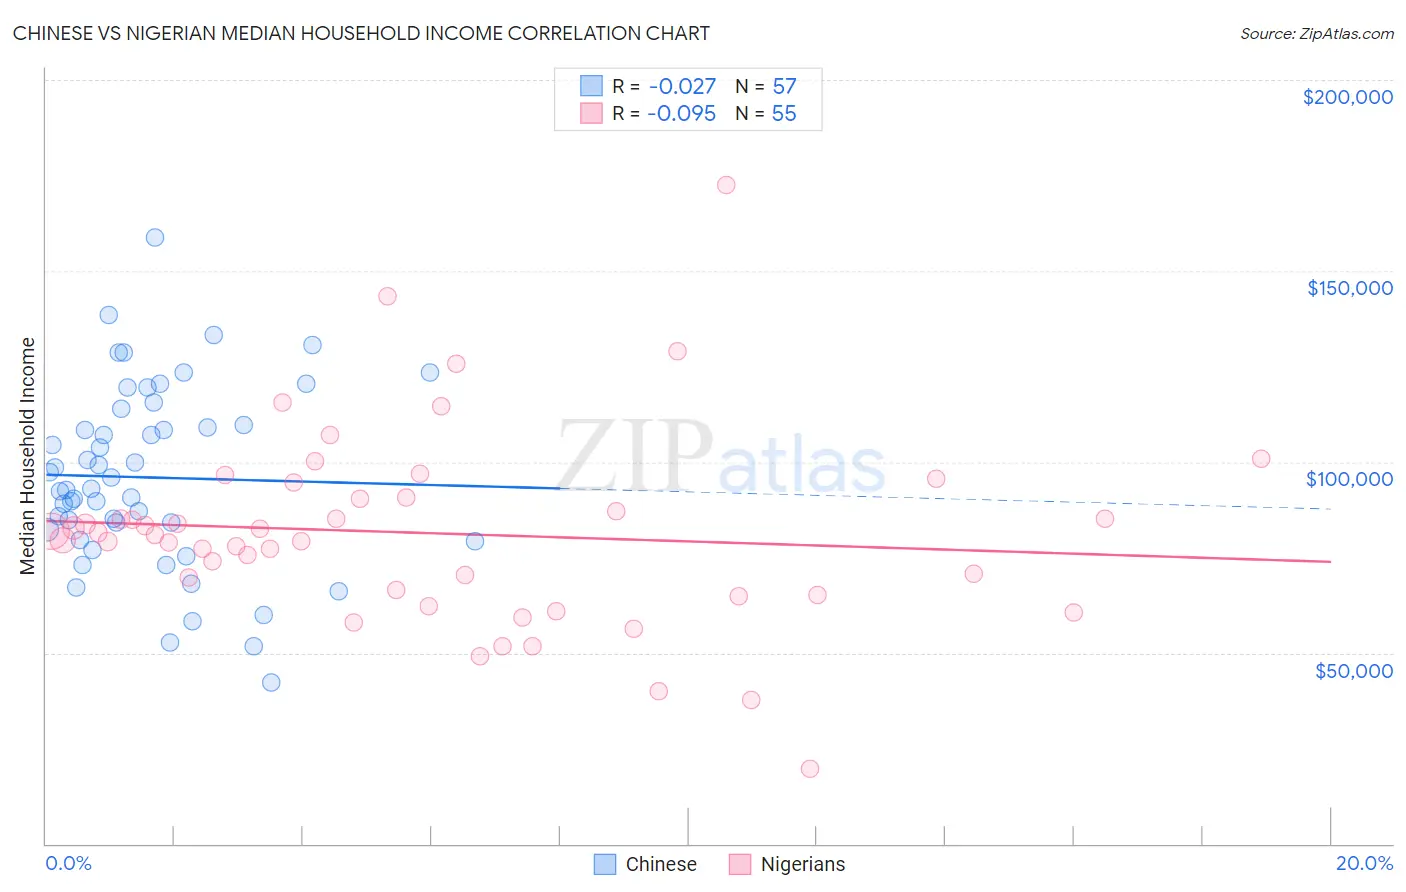
Chinese vs Nigerian Median Household Income Correlation Chart
The statistical analysis conducted on geographies consisting of 64,799,903 people shows no correlation between the proportion of Chinese and median household income in the United States with a correlation coefficient (R) of -0.027 and weighted average of $98,496. Similarly, the statistical analysis conducted on geographies consisting of 332,385,010 people shows a slight negative correlation between the proportion of Nigerians and median household income in the United States with a correlation coefficient (R) of -0.095 and weighted average of $81,725, a difference of 20.5%.
Median Household Income Correlation Summary
| Measurement | Chinese | Nigerian |
| Minimum | $42,222 | $19,722 |
| Maximum | $158,665 | $172,388 |
| Range | $116,443 | $152,666 |
| Mean | $95,906 | $81,339 |
| Median | $92,903 | $80,919 |
| Interquartile 25% (IQ1) | $80,796 | $65,240 |
| Interquartile 75% (IQ3) | $111,792 | $90,601 |
| Interquartile Range (IQR) | $30,996 | $25,361 |
| Standard Deviation (Sample) | $23,711 | $25,635 |
| Standard Deviation (Population) | $23,502 | $25,401 |
Similar Demographics by Median Household Income
Demographics Similar to Chinese by Median Household Income
In terms of median household income, the demographic groups most similar to Chinese are Immigrants from Denmark ($98,510, a difference of 0.010%), Russian ($98,008, a difference of 0.50%), Immigrants from Switzerland ($97,979, a difference of 0.53%), Turkish ($99,389, a difference of 0.91%), and Immigrants from Pakistan ($97,528, a difference of 0.99%).
| Demographics | Rating | Rank | Median Household Income |
| Immigrants | Belgium | 100.0 /100 | #26 | Exceptional $100,306 |
| Bhutanese | 100.0 /100 | #27 | Exceptional $100,151 |
| Immigrants | Sri Lanka | 100.0 /100 | #28 | Exceptional $99,943 |
| Immigrants | Asia | 100.0 /100 | #29 | Exceptional $99,933 |
| Immigrants | Northern Europe | 100.0 /100 | #30 | Exceptional $99,813 |
| Turks | 100.0 /100 | #31 | Exceptional $99,389 |
| Immigrants | Denmark | 100.0 /100 | #32 | Exceptional $98,510 |
| Chinese | 100.0 /100 | #33 | Exceptional $98,496 |
| Russians | 100.0 /100 | #34 | Exceptional $98,008 |
| Immigrants | Switzerland | 100.0 /100 | #35 | Exceptional $97,979 |
| Immigrants | Pakistan | 100.0 /100 | #36 | Exceptional $97,528 |
| Latvians | 100.0 /100 | #37 | Exceptional $97,311 |
| Immigrants | Indonesia | 100.0 /100 | #38 | Exceptional $97,297 |
| Afghans | 100.0 /100 | #39 | Exceptional $97,026 |
| Maltese | 100.0 /100 | #40 | Exceptional $97,015 |
Demographics Similar to Nigerians by Median Household Income
In terms of median household income, the demographic groups most similar to Nigerians are Immigrants from Venezuela ($81,506, a difference of 0.27%), Immigrants from Ghana ($81,489, a difference of 0.29%), White/Caucasian ($82,029, a difference of 0.37%), Ecuadorian ($82,070, a difference of 0.42%), and Yugoslavian ($82,186, a difference of 0.56%).
| Demographics | Rating | Rank | Median Household Income |
| Venezuelans | 15.3 /100 | #212 | Poor $82,432 |
| Nepalese | 15.1 /100 | #213 | Poor $82,410 |
| Panamanians | 14.0 /100 | #214 | Poor $82,272 |
| Vietnamese | 13.8 /100 | #215 | Poor $82,248 |
| Yugoslavians | 13.3 /100 | #216 | Poor $82,186 |
| Ecuadorians | 12.5 /100 | #217 | Poor $82,070 |
| Whites/Caucasians | 12.2 /100 | #218 | Poor $82,029 |
| Nigerians | 10.3 /100 | #219 | Poor $81,725 |
| Immigrants | Venezuela | 9.0 /100 | #220 | Tragic $81,506 |
| Immigrants | Ghana | 9.0 /100 | #221 | Tragic $81,489 |
| Immigrants | Nigeria | 7.7 /100 | #222 | Tragic $81,236 |
| Immigrants | El Salvador | 7.6 /100 | #223 | Tragic $81,213 |
| Malaysians | 7.0 /100 | #224 | Tragic $81,064 |
| Scotch-Irish | 6.6 /100 | #225 | Tragic $80,972 |
| Immigrants | Panama | 6.2 /100 | #226 | Tragic $80,873 |