Sri Lankan vs Immigrants from Scotland Median Household Income
COMPARE
Sri Lankan
Immigrants from Scotland
Median Household Income
Median Household Income Comparison
Sri Lankans
Immigrants from Scotland
$93,093
MEDIAN HOUSEHOLD INCOME
99.4/ 100
METRIC RATING
79th/ 347
METRIC RANK
$94,091
MEDIAN HOUSEHOLD INCOME
99.7/ 100
METRIC RATING
67th/ 347
METRIC RANK
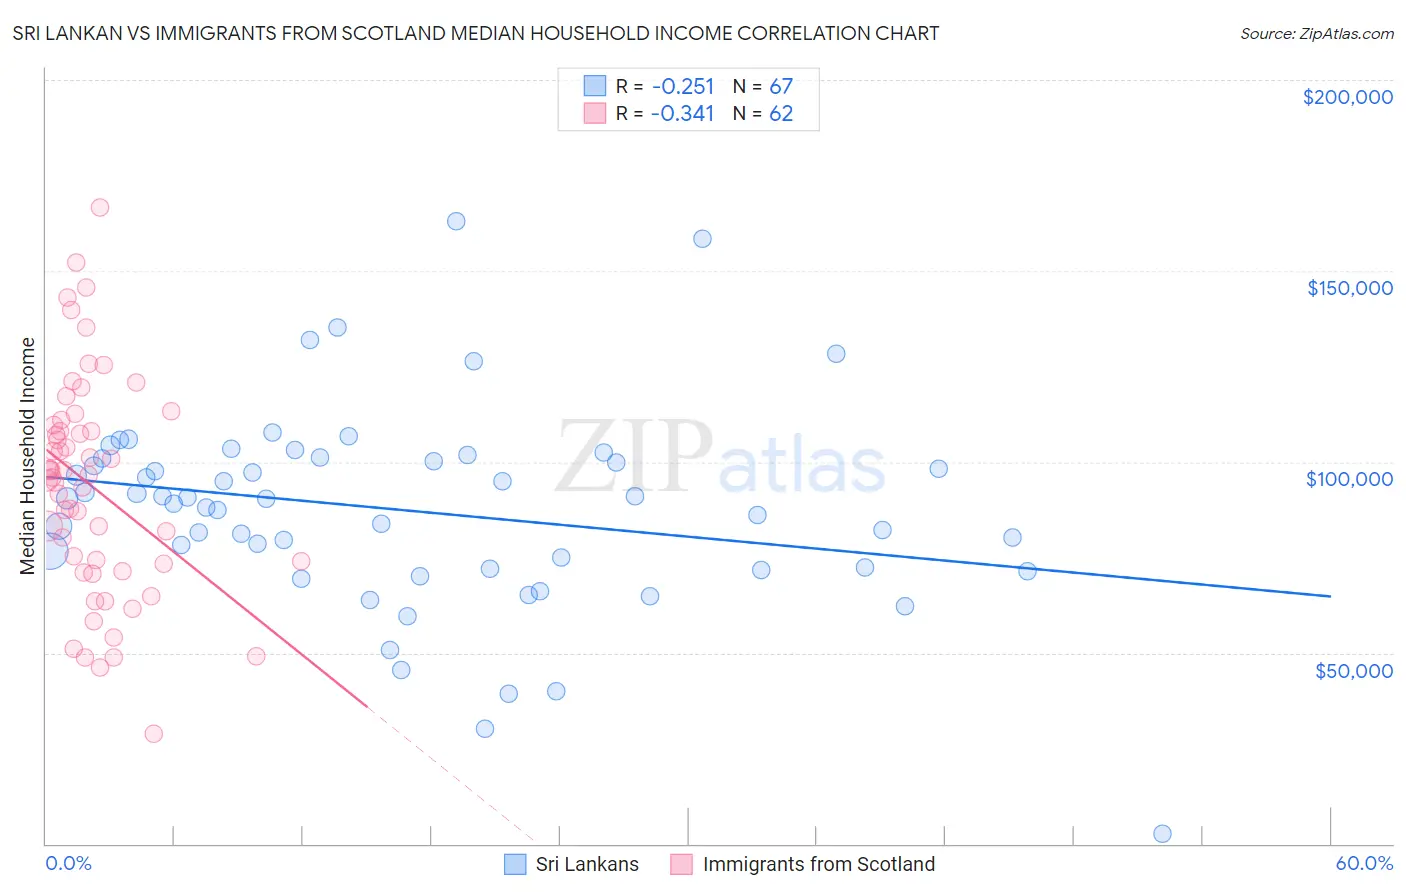
Sri Lankan vs Immigrants from Scotland Median Household Income Correlation Chart
The statistical analysis conducted on geographies consisting of 439,964,424 people shows a weak negative correlation between the proportion of Sri Lankans and median household income in the United States with a correlation coefficient (R) of -0.251 and weighted average of $93,093. Similarly, the statistical analysis conducted on geographies consisting of 196,370,497 people shows a mild negative correlation between the proportion of Immigrants from Scotland and median household income in the United States with a correlation coefficient (R) of -0.341 and weighted average of $94,091, a difference of 1.1%.
Median Household Income Correlation Summary
| Measurement | Sri Lankan | Immigrants from Scotland |
| Minimum | $2,499 | $28,750 |
| Maximum | $163,019 | $166,597 |
| Range | $160,520 | $137,847 |
| Mean | $87,249 | $93,595 |
| Median | $90,272 | $96,232 |
| Interquartile 25% (IQ1) | $71,944 | $73,269 |
| Interquartile 75% (IQ3) | $100,934 | $109,596 |
| Interquartile Range (IQR) | $28,990 | $36,327 |
| Standard Deviation (Sample) | $26,489 | $28,531 |
| Standard Deviation (Population) | $26,291 | $28,300 |
Demographics Similar to Sri Lankans and Immigrants from Scotland by Median Household Income
In terms of median household income, the demographic groups most similar to Sri Lankans are Tongan ($93,076, a difference of 0.020%), Immigrants from Eastern Europe ($93,051, a difference of 0.050%), Immigrants from Bulgaria ($93,148, a difference of 0.060%), Immigrants from Afghanistan ($93,375, a difference of 0.30%), and South African ($93,379, a difference of 0.31%). Similarly, the demographic groups most similar to Immigrants from Scotland are Mongolian ($93,971, a difference of 0.13%), Immigrants from Romania ($94,222, a difference of 0.14%), Argentinean ($93,960, a difference of 0.14%), Immigrants from Fiji ($93,933, a difference of 0.17%), and Immigrants from Philippines ($93,899, a difference of 0.20%).
| Demographics | Rating | Rank | Median Household Income |
| Greeks | 99.8 /100 | #63 | Exceptional $94,735 |
| Immigrants | Netherlands | 99.7 /100 | #64 | Exceptional $94,411 |
| Immigrants | Belarus | 99.7 /100 | #65 | Exceptional $94,399 |
| Immigrants | Romania | 99.7 /100 | #66 | Exceptional $94,222 |
| Immigrants | Scotland | 99.7 /100 | #67 | Exceptional $94,091 |
| Mongolians | 99.7 /100 | #68 | Exceptional $93,971 |
| Argentineans | 99.7 /100 | #69 | Exceptional $93,960 |
| Immigrants | Fiji | 99.7 /100 | #70 | Exceptional $93,933 |
| Immigrants | Philippines | 99.6 /100 | #71 | Exceptional $93,899 |
| Lithuanians | 99.6 /100 | #72 | Exceptional $93,852 |
| Immigrants | Egypt | 99.6 /100 | #73 | Exceptional $93,700 |
| Immigrants | Latvia | 99.6 /100 | #74 | Exceptional $93,602 |
| Immigrants | Italy | 99.5 /100 | #75 | Exceptional $93,465 |
| South Africans | 99.5 /100 | #76 | Exceptional $93,379 |
| Immigrants | Afghanistan | 99.5 /100 | #77 | Exceptional $93,375 |
| Immigrants | Bulgaria | 99.4 /100 | #78 | Exceptional $93,148 |
| Sri Lankans | 99.4 /100 | #79 | Exceptional $93,093 |
| Tongans | 99.4 /100 | #80 | Exceptional $93,076 |
| Immigrants | Eastern Europe | 99.4 /100 | #81 | Exceptional $93,051 |
| Immigrants | Spain | 99.3 /100 | #82 | Exceptional $92,732 |
| Italians | 99.1 /100 | #83 | Exceptional $92,475 |