Cuban vs Immigrants from Ireland Median Female Earnings
COMPARE
Cuban
Immigrants from Ireland
Median Female Earnings
Median Female Earnings Comparison
Cubans
Immigrants from Ireland
$34,942
MEDIAN FEMALE EARNINGS
0.0/ 100
METRIC RATING
313th/ 347
METRIC RANK
$47,598
MEDIAN FEMALE EARNINGS
100.0/ 100
METRIC RATING
6th/ 347
METRIC RANK
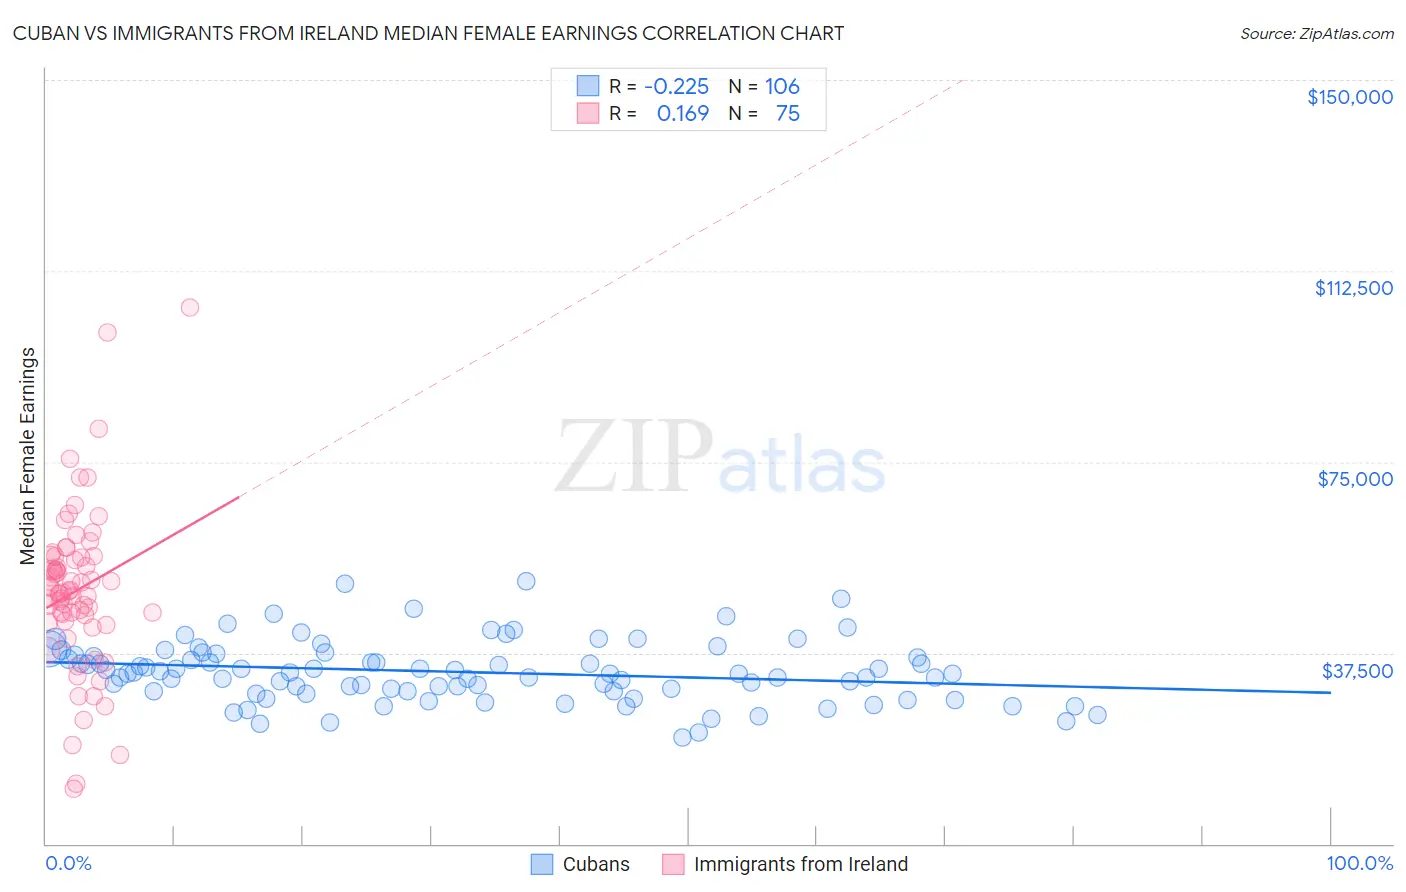
Cuban vs Immigrants from Ireland Median Female Earnings Correlation Chart
The statistical analysis conducted on geographies consisting of 449,056,362 people shows a weak negative correlation between the proportion of Cubans and median female earnings in the United States with a correlation coefficient (R) of -0.225 and weighted average of $34,942. Similarly, the statistical analysis conducted on geographies consisting of 240,688,654 people shows a poor positive correlation between the proportion of Immigrants from Ireland and median female earnings in the United States with a correlation coefficient (R) of 0.169 and weighted average of $47,598, a difference of 36.2%.
Median Female Earnings Correlation Summary
| Measurement | Cuban | Immigrants from Ireland |
| Minimum | $20,938 | $10,833 |
| Maximum | $51,542 | $105,254 |
| Range | $30,604 | $94,421 |
| Mean | $33,741 | $49,745 |
| Median | $33,424 | $49,556 |
| Interquartile 25% (IQ1) | $29,890 | $43,791 |
| Interquartile 75% (IQ3) | $37,174 | $56,354 |
| Interquartile Range (IQR) | $7,284 | $12,564 |
| Standard Deviation (Sample) | $5,986 | $15,960 |
| Standard Deviation (Population) | $5,958 | $15,854 |
Similar Demographics by Median Female Earnings
Demographics Similar to Cubans by Median Female Earnings
In terms of median female earnings, the demographic groups most similar to Cubans are Yaqui ($34,943, a difference of 0.0%), Ute ($34,960, a difference of 0.050%), Apache ($34,895, a difference of 0.13%), Chippewa ($35,003, a difference of 0.17%), and Honduran ($35,013, a difference of 0.20%).
| Demographics | Rating | Rank | Median Female Earnings |
| Fijians | 0.0 /100 | #306 | Tragic $35,114 |
| Sioux | 0.0 /100 | #307 | Tragic $35,063 |
| Immigrants | Bahamas | 0.0 /100 | #308 | Tragic $35,027 |
| Hondurans | 0.0 /100 | #309 | Tragic $35,013 |
| Chippewa | 0.0 /100 | #310 | Tragic $35,003 |
| Ute | 0.0 /100 | #311 | Tragic $34,960 |
| Yaqui | 0.0 /100 | #312 | Tragic $34,943 |
| Cubans | 0.0 /100 | #313 | Tragic $34,942 |
| Apache | 0.0 /100 | #314 | Tragic $34,895 |
| Pennsylvania Germans | 0.0 /100 | #315 | Tragic $34,802 |
| Cherokee | 0.0 /100 | #316 | Tragic $34,742 |
| Potawatomi | 0.0 /100 | #317 | Tragic $34,739 |
| Immigrants | Yemen | 0.0 /100 | #318 | Tragic $34,693 |
| Shoshone | 0.0 /100 | #319 | Tragic $34,677 |
| Immigrants | Honduras | 0.0 /100 | #320 | Tragic $34,647 |
Demographics Similar to Immigrants from Ireland by Median Female Earnings
In terms of median female earnings, the demographic groups most similar to Immigrants from Ireland are Thai ($47,577, a difference of 0.040%), Iranian ($47,421, a difference of 0.37%), Immigrants from Singapore ($47,986, a difference of 0.82%), Immigrants from Iran ($47,154, a difference of 0.94%), and Immigrants from China ($46,972, a difference of 1.3%).
| Demographics | Rating | Rank | Median Female Earnings |
| Immigrants | Hong Kong | 100.0 /100 | #1 | Exceptional $49,818 |
| Filipinos | 100.0 /100 | #2 | Exceptional $49,508 |
| Immigrants | Taiwan | 100.0 /100 | #3 | Exceptional $49,256 |
| Immigrants | India | 100.0 /100 | #4 | Exceptional $48,292 |
| Immigrants | Singapore | 100.0 /100 | #5 | Exceptional $47,986 |
| Immigrants | Ireland | 100.0 /100 | #6 | Exceptional $47,598 |
| Thais | 100.0 /100 | #7 | Exceptional $47,577 |
| Iranians | 100.0 /100 | #8 | Exceptional $47,421 |
| Immigrants | Iran | 100.0 /100 | #9 | Exceptional $47,154 |
| Immigrants | China | 100.0 /100 | #10 | Exceptional $46,972 |
| Okinawans | 100.0 /100 | #11 | Exceptional $46,905 |
| Immigrants | Israel | 100.0 /100 | #12 | Exceptional $46,902 |
| Immigrants | Australia | 100.0 /100 | #13 | Exceptional $46,573 |
| Soviet Union | 100.0 /100 | #14 | Exceptional $46,556 |
| Immigrants | Eastern Asia | 100.0 /100 | #15 | Exceptional $46,502 |