Vietnamese vs South African Median Female Earnings
COMPARE
Vietnamese
South African
Median Female Earnings
Median Female Earnings Comparison
Vietnamese
South Africans
$40,377
MEDIAN FEMALE EARNINGS
80.4/ 100
METRIC RATING
147th/ 347
METRIC RANK
$41,825
MEDIAN FEMALE EARNINGS
98.8/ 100
METRIC RATING
96th/ 347
METRIC RANK
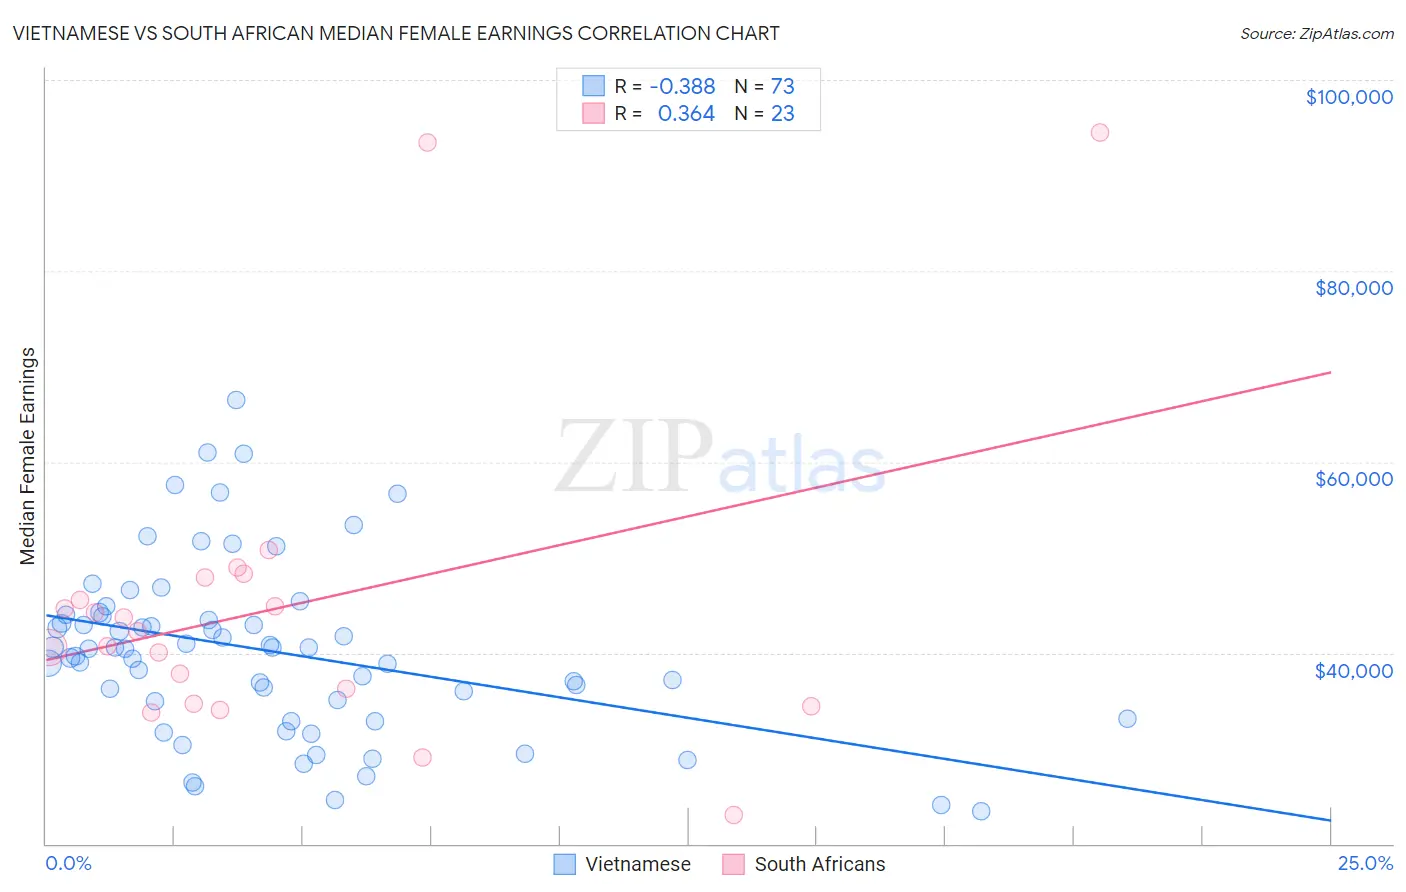
Vietnamese vs South African Median Female Earnings Correlation Chart
The statistical analysis conducted on geographies consisting of 170,738,706 people shows a mild negative correlation between the proportion of Vietnamese and median female earnings in the United States with a correlation coefficient (R) of -0.388 and weighted average of $40,377. Similarly, the statistical analysis conducted on geographies consisting of 182,555,636 people shows a mild positive correlation between the proportion of South Africans and median female earnings in the United States with a correlation coefficient (R) of 0.364 and weighted average of $41,825, a difference of 3.6%.
Median Female Earnings Correlation Summary
| Measurement | Vietnamese | South African |
| Minimum | $23,385 | $23,068 |
| Maximum | $66,442 | $94,510 |
| Range | $43,057 | $71,442 |
| Mean | $40,184 | $44,927 |
| Median | $40,448 | $42,310 |
| Interquartile 25% (IQ1) | $34,018 | $34,713 |
| Interquartile 75% (IQ3) | $43,912 | $47,886 |
| Interquartile Range (IQR) | $9,894 | $13,173 |
| Standard Deviation (Sample) | $9,135 | $16,884 |
| Standard Deviation (Population) | $9,072 | $16,513 |
Similar Demographics by Median Female Earnings
Demographics Similar to Vietnamese by Median Female Earnings
In terms of median female earnings, the demographic groups most similar to Vietnamese are Polish ($40,371, a difference of 0.020%), Immigrants from Cameroon ($40,354, a difference of 0.060%), Immigrants from Chile ($40,353, a difference of 0.060%), Immigrants from Armenia ($40,340, a difference of 0.090%), and Ghanaian ($40,429, a difference of 0.13%).
| Demographics | Rating | Rank | Median Female Earnings |
| Serbians | 85.2 /100 | #140 | Excellent $40,539 |
| Immigrants | Syria | 84.1 /100 | #141 | Excellent $40,499 |
| Sri Lankans | 84.0 /100 | #142 | Excellent $40,496 |
| Northern Europeans | 83.9 /100 | #143 | Excellent $40,491 |
| Immigrants | North Macedonia | 83.8 /100 | #144 | Excellent $40,488 |
| Brazilians | 83.6 /100 | #145 | Excellent $40,483 |
| Ghanaians | 82.1 /100 | #146 | Excellent $40,429 |
| Vietnamese | 80.4 /100 | #147 | Excellent $40,377 |
| Poles | 80.2 /100 | #148 | Excellent $40,371 |
| Immigrants | Cameroon | 79.7 /100 | #149 | Good $40,354 |
| Immigrants | Chile | 79.6 /100 | #150 | Good $40,353 |
| Immigrants | Armenia | 79.2 /100 | #151 | Good $40,340 |
| West Indians | 78.4 /100 | #152 | Good $40,317 |
| British West Indians | 77.7 /100 | #153 | Good $40,299 |
| Immigrants | Oceania | 77.6 /100 | #154 | Good $40,297 |
Demographics Similar to South Africans by Median Female Earnings
In terms of median female earnings, the demographic groups most similar to South Africans are Immigrants from Hungary ($41,820, a difference of 0.010%), Moroccan ($41,872, a difference of 0.11%), Immigrants from Netherlands ($41,870, a difference of 0.11%), Immigrants from Scotland ($41,771, a difference of 0.13%), and Immigrants from Grenada ($41,932, a difference of 0.26%).
| Demographics | Rating | Rank | Median Female Earnings |
| Immigrants | Afghanistan | 99.3 /100 | #89 | Exceptional $42,055 |
| Ukrainians | 99.2 /100 | #90 | Exceptional $42,015 |
| Immigrants | Western Europe | 99.2 /100 | #91 | Exceptional $41,990 |
| Argentineans | 99.1 /100 | #92 | Exceptional $41,952 |
| Immigrants | Grenada | 99.0 /100 | #93 | Exceptional $41,932 |
| Moroccans | 98.9 /100 | #94 | Exceptional $41,872 |
| Immigrants | Netherlands | 98.9 /100 | #95 | Exceptional $41,870 |
| South Africans | 98.8 /100 | #96 | Exceptional $41,825 |
| Immigrants | Hungary | 98.8 /100 | #97 | Exceptional $41,820 |
| Immigrants | Scotland | 98.7 /100 | #98 | Exceptional $41,771 |
| Immigrants | Barbados | 98.4 /100 | #99 | Exceptional $41,685 |
| Romanians | 98.3 /100 | #100 | Exceptional $41,663 |
| Immigrants | Fiji | 98.3 /100 | #101 | Exceptional $41,656 |
| Immigrants | Poland | 98.2 /100 | #102 | Exceptional $41,630 |
| Immigrants | Argentina | 97.9 /100 | #103 | Exceptional $41,554 |