Cuban vs Immigrants from South Africa Median Female Earnings
COMPARE
Cuban
Immigrants from South Africa
Median Female Earnings
Median Female Earnings Comparison
Cubans
Immigrants from South Africa
$34,942
MEDIAN FEMALE EARNINGS
0.0/ 100
METRIC RATING
313th/ 347
METRIC RANK
$42,508
MEDIAN FEMALE EARNINGS
99.7/ 100
METRIC RATING
74th/ 347
METRIC RANK
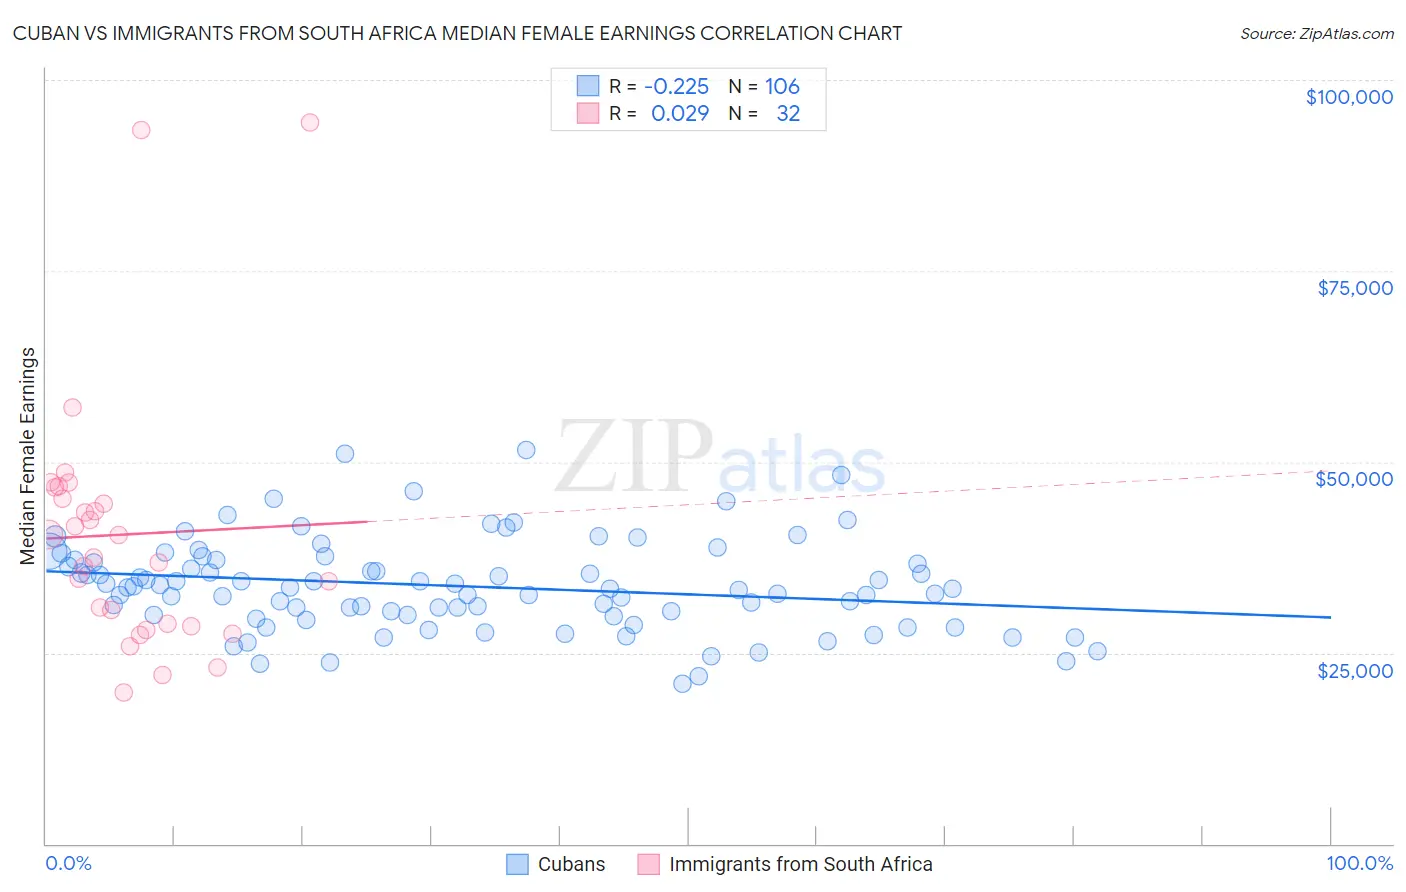
Cuban vs Immigrants from South Africa Median Female Earnings Correlation Chart
The statistical analysis conducted on geographies consisting of 449,056,362 people shows a weak negative correlation between the proportion of Cubans and median female earnings in the United States with a correlation coefficient (R) of -0.225 and weighted average of $34,942. Similarly, the statistical analysis conducted on geographies consisting of 233,273,838 people shows no correlation between the proportion of Immigrants from South Africa and median female earnings in the United States with a correlation coefficient (R) of 0.029 and weighted average of $42,508, a difference of 21.6%.
Median Female Earnings Correlation Summary
| Measurement | Cuban | Immigrants from South Africa |
| Minimum | $20,938 | $19,821 |
| Maximum | $51,542 | $94,510 |
| Range | $30,604 | $74,689 |
| Mean | $33,741 | $40,489 |
| Median | $33,424 | $38,975 |
| Interquartile 25% (IQ1) | $29,890 | $28,607 |
| Interquartile 75% (IQ3) | $37,174 | $45,877 |
| Interquartile Range (IQR) | $7,284 | $17,270 |
| Standard Deviation (Sample) | $5,986 | $16,714 |
| Standard Deviation (Population) | $5,958 | $16,451 |
Similar Demographics by Median Female Earnings
Demographics Similar to Cubans by Median Female Earnings
In terms of median female earnings, the demographic groups most similar to Cubans are Yaqui ($34,943, a difference of 0.0%), Ute ($34,960, a difference of 0.050%), Apache ($34,895, a difference of 0.13%), Chippewa ($35,003, a difference of 0.17%), and Honduran ($35,013, a difference of 0.20%).
| Demographics | Rating | Rank | Median Female Earnings |
| Fijians | 0.0 /100 | #306 | Tragic $35,114 |
| Sioux | 0.0 /100 | #307 | Tragic $35,063 |
| Immigrants | Bahamas | 0.0 /100 | #308 | Tragic $35,027 |
| Hondurans | 0.0 /100 | #309 | Tragic $35,013 |
| Chippewa | 0.0 /100 | #310 | Tragic $35,003 |
| Ute | 0.0 /100 | #311 | Tragic $34,960 |
| Yaqui | 0.0 /100 | #312 | Tragic $34,943 |
| Cubans | 0.0 /100 | #313 | Tragic $34,942 |
| Apache | 0.0 /100 | #314 | Tragic $34,895 |
| Pennsylvania Germans | 0.0 /100 | #315 | Tragic $34,802 |
| Cherokee | 0.0 /100 | #316 | Tragic $34,742 |
| Potawatomi | 0.0 /100 | #317 | Tragic $34,739 |
| Immigrants | Yemen | 0.0 /100 | #318 | Tragic $34,693 |
| Shoshone | 0.0 /100 | #319 | Tragic $34,677 |
| Immigrants | Honduras | 0.0 /100 | #320 | Tragic $34,647 |
Demographics Similar to Immigrants from South Africa by Median Female Earnings
In terms of median female earnings, the demographic groups most similar to Immigrants from South Africa are Mongolian ($42,542, a difference of 0.080%), New Zealander ($42,446, a difference of 0.15%), Immigrants from Italy ($42,446, a difference of 0.15%), Albanian ($42,584, a difference of 0.18%), and Immigrants from Albania ($42,388, a difference of 0.28%).
| Demographics | Rating | Rank | Median Female Earnings |
| Immigrants | Egypt | 99.9 /100 | #67 | Exceptional $42,837 |
| Immigrants | Austria | 99.8 /100 | #68 | Exceptional $42,824 |
| Immigrants | Spain | 99.8 /100 | #69 | Exceptional $42,815 |
| Immigrants | Ethiopia | 99.8 /100 | #70 | Exceptional $42,744 |
| Immigrants | Romania | 99.8 /100 | #71 | Exceptional $42,718 |
| Albanians | 99.8 /100 | #72 | Exceptional $42,584 |
| Mongolians | 99.7 /100 | #73 | Exceptional $42,542 |
| Immigrants | South Africa | 99.7 /100 | #74 | Exceptional $42,508 |
| New Zealanders | 99.7 /100 | #75 | Exceptional $42,446 |
| Immigrants | Italy | 99.7 /100 | #76 | Exceptional $42,446 |
| Immigrants | Albania | 99.6 /100 | #77 | Exceptional $42,388 |
| Immigrants | Kazakhstan | 99.6 /100 | #78 | Exceptional $42,386 |
| Greeks | 99.6 /100 | #79 | Exceptional $42,336 |
| Immigrants | Moldova | 99.6 /100 | #80 | Exceptional $42,304 |
| Immigrants | Southern Europe | 99.5 /100 | #81 | Exceptional $42,275 |